Core Web Vitals are Google's answer to a question that used to be argued about: what does "fast" mean to a visitor? The answer is three measurements, taken from real Chrome users, each with a threshold. They are part of how Google ranks pages, they appear in Search Console, and every speed tool reports them. This guide explains what each one measures in visitor terms, where the numbers come from, and what usually causes a bad one. The fixes have their own guides.
Quick answer
| Vital | Question it answers | Good | Poor |
|---|---|---|---|
| LCP Largest Contentful Paint | How long until the main content is on screen? | ≤ 2.5 s | > 4.0 s |
| INP Interaction to Next Paint | How long between a tap and the screen reacting? | ≤ 200 ms | > 500 ms |
| CLS Cumulative Layout Shift | How much did things jump around while loading? | ≤ 0.1 | > 0.25 |
A page passes when 75 % of visits are "good" on all three. The Core Web Vitals checker shows the field numbers for your page and origin next to a lab run.
Where the numbers come from
Chrome sends anonymous timing data from real visits to Google (users can opt out; the dataset is called CrUX). Google aggregates it per URL and per origin over a rolling 28 days and reports the 75th percentile: the value that three quarters of visits stayed under. That is the "field data" in Search Console and in speed tools. It is the only data Google uses for the ranking signal.
A lab tool (Lighthouse) loads the page once in a simulated phone and measures LCP and CLS directly; it cannot measure INP because it does not interact, so it reports Total Blocking Time as a stand-in. Lab data is for diagnosis: it is reproducible and it explains the field numbers.
Pages with little traffic have no field data. Google then uses the origin's aggregate; a brand-new site has nothing and is simply not judged on this until it does.
LCP: is the main thing visible yet?
The browser watches the largest image or text block in the viewport as the page loads and records when it was painted. On a product page that is the product photo; on an article, the headline or the hero image; on a home page, the banner. Everything the browser must do before that paint counts: the server thinking, the HTML arriving, CSS blocking the render, a web font that the headline waits for, and the image file itself.
Typical causes of a poor LCP, most common first:
- The LCP image is large (a camera original) or served in an old format.
- The LCP image is lazy-loaded, so it only starts downloading after the layout is done.
- Render-blocking CSS or JavaScript in the
<head>delays the first paint. - A slow server: TTFB over a second on shared hosting or an uncached CMS page.
- A web font the headline waits for, with no
font-displayfallback.
Each is in How to fix Largest Contentful Paint.
INP: does it react when I tap?
Every time a visitor taps, clicks or types, the browser measures the time until the next frame is drawn. INP is close to the worst of those over the whole visit (the slowest interaction, ignoring a few outliers on pages with many interactions). Under 200 ms feels instant; over 500 ms feels broken, like a menu that opens a moment after you tapped it.
The cause is almost always JavaScript running on the main thread when the tap arrives: a tag manager firing tags, a heavy framework hydrating, an event handler that does too much (recalculating the whole page on every keystroke), or third-party scripts (chat, A/B testing, ads) competing for the same thread.
INP replaced First Input Delay in 2024. FID only measured the first interaction and only the delay before the handler ran; INP measures all interactions until the screen updates, which is why sites that passed FID can fail INP. See How to fix Interaction to Next Paint.
CLS: did the page jump?
Layout shift is when something visible moves without the visitor doing anything: the text jumps down when an image above it loads, a cookie banner pushes the page, a font swap makes a paragraph longer. Each shift is scored by how much of the viewport moved and how far; CLS adds up the shifts in the worst burst. 0.1 means roughly "a tenth of the screen moved a bit"; 0.25 is the page visibly rearranging itself.
The four usual causes:
- Images and embeds without
widthandheight(the browser cannot reserve space). - Web fonts loading after the text was drawn in a fallback font.
- Content injected above existing content: banners, notices, ads.
- Animations that change layout properties (height, top) instead of transforms.
The fixes are in How to fix Cumulative Layout Shift; the first one alone fixes most sites.
How getReport checks it
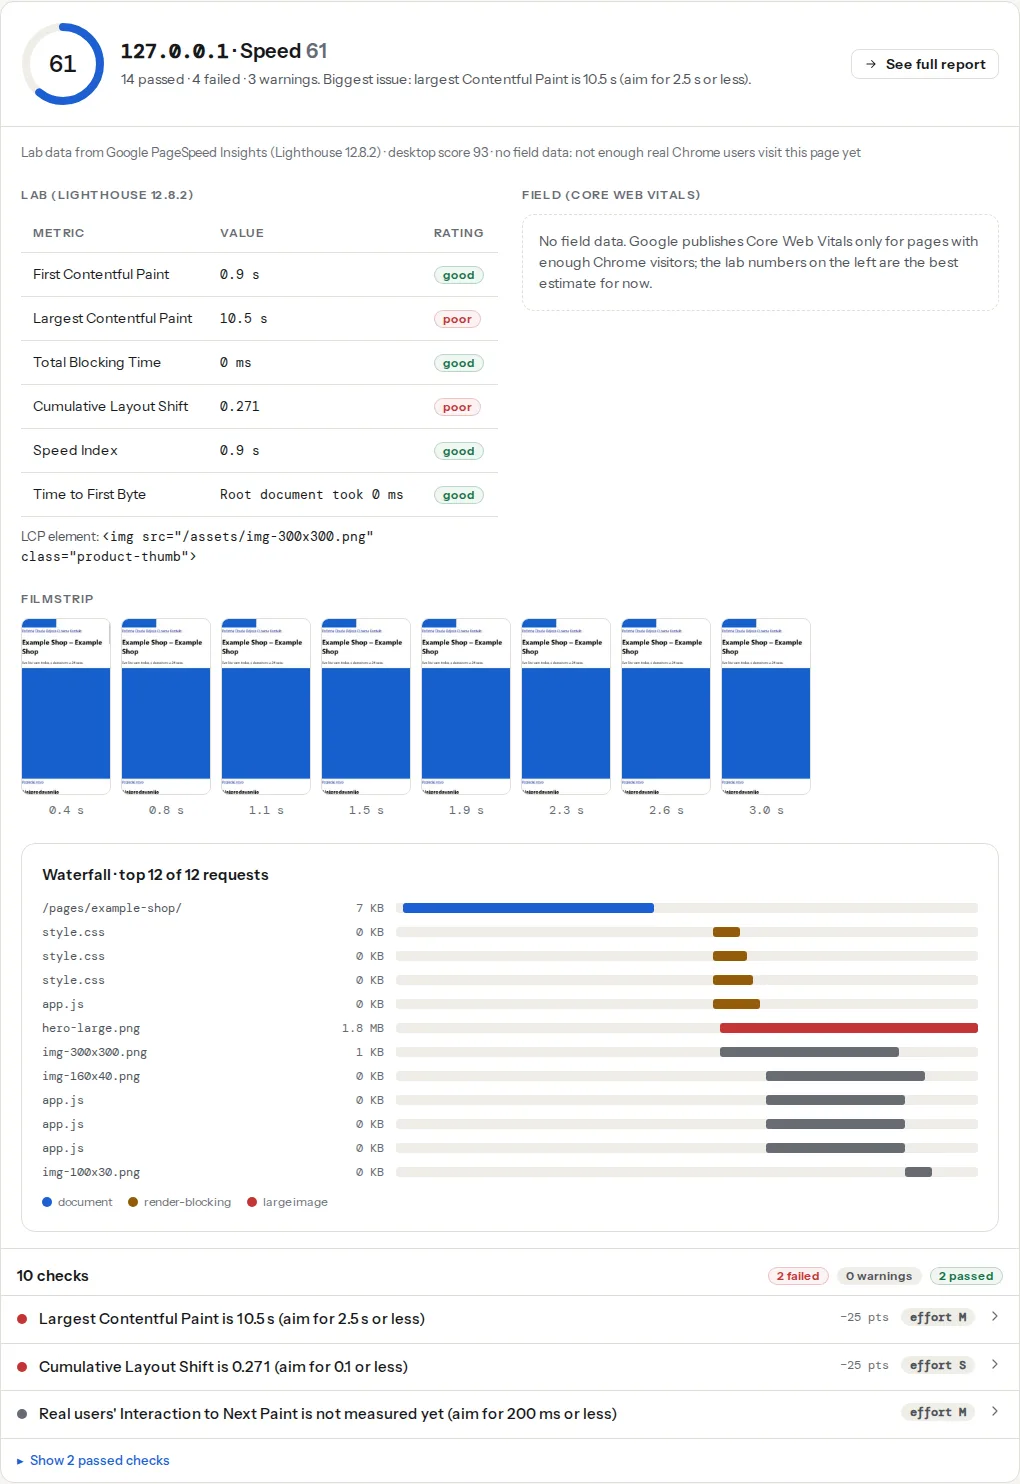
The checker requests the CrUX field data for the exact URL and for the origin, and a Lighthouse lab run, then shows both: bars for the share of visits in each band, and the lab values with the element responsible. The speed module's findings turn each lab audit into a fix.
Reading your result
- All three green in the field: the page passes. Look at the origin numbers too; Google may judge low-traffic pages by the origin.
- LCP red, others green: a loading problem; the lab LCP element tells you what to fix.
- INP red, lab TBT high: JavaScript; look at the main-thread findings and third-party scripts.
- INP red, lab TBT low: the lab did not trigger the slow interaction; it is something visitors do (open the menu, use the search, add to cart). Test those interactions in the browser's performance panel.
- CLS red, lab CLS low: a shift that happens later in the visit, after the lab test ended: a late-loading ad, a sticky banner, a font on a page the test did not scroll. The lab measures only the load.
- No field data: not enough traffic on that URL. Use the origin, or the lab data as a proxy.
What Core Web Vitals do and do not do for ranking
They are one signal among many, a tie-breaker between pages with similar relevance rather than a way to outrank better content. A page that fails them can still rank first if it is the best answer. But the same numbers decide whether visitors stay, and that shows up everywhere: bounce rate, conversions, ad revenue. Fixing them is worth it for the visitors even where the ranking effect is small.
Verify
- Search Console → Core Web Vitals lists your URL groups as Good, Needs improvement or Poor, updated daily over a 28-day window.
- The checker's field bars match Search Console (they use the same dataset, with a day or two of lag).
- After a fix, the lab value improves immediately; the field value follows over the next four weeks.
Common mistakes
- Reading the lab score as the ranking signal. Google uses the field data.
- Expecting field numbers to change the day after a fix. They cover 28 days.
- Fixing the home page only. Search Console groups similar URLs; the product template matters more.
- Chasing 100. Under the thresholds is the goal; the last few points cost more than they return.
- Adding scripts to measure performance that themselves make INP worse. Use CrUX and the browser's tools.