Interaction to Next Paint (INP) is the time between a visitor's tap, click or key press and the next frame the page draws in response, taken from one of the slowest interactions of the visit. Google rates it good at 200 ms or less and poor above 500 ms, at the 75th percentile of real visits, and it has been the responsiveness Core Web Vital since it replaced First Input Delay on 12 March 2024. A menu that opens 600 ms after the tap or a filter that freezes the product grid is a poor INP. This guide explains where the time goes, how to find the slow interaction, and the fixes, most of which come down to running less JavaScript at the wrong moment. For how INP fits with LCP and CLS, see Core Web Vitals for site owners.
Quick answer
| INP | Rating |
|---|---|
| ≤ 200 ms | Good |
| 200-500 ms | Needs improvement |
| > 500 ms | Poor |
- INP only exists in field data from real users; the Core Web Vitals checker shows it when Google has enough visits. Lab tools report Total Blocking Time as the stand-in.
- The cause is almost always JavaScript on the main thread: long tasks, heavy click handlers, third-party tags.
- Break up long tasks and yield to the browser (
scheduler.yield()orsetTimeout) so it can paint between chunks. - In event handlers, show the visual response first, then do the heavy work.
- Remove or delay third-party scripts nobody uses, and defer everything not needed for the first screen.
- Keep the DOM small; every update has to lay it out again.
What is INP?
INP watches every click, tap and key press during a visit, from the moment the input arrives until the browser paints the next frame. At the end of the visit it reports the slowest one; on pages with many interactions it ignores one outlier for every 50 interactions, so a single freak delay does not define the page. Hovering and scrolling are not counted.
A page that ignores a tap feels broken, even if it loaded quickly. Visitors tap again, and the second tap lands on whatever appeared in the meantime. On a shop the slow interactions are the valuable ones: add to cart, size selection, filters, the checkout form.
Why INP replaced FID in March 2024
First Input Delay measured only the wait before the first interaction's handler started. It ignored the handler's own run time, the time to paint the result, and every interaction after the first, so a page could pass it and still feel slow to use. INP covers the whole visit and the whole delay until the screen updates, so it matches what visitors feel. Google made INP a Core Web Vital on 12 March 2024, and FID was removed from Search Console and PageSpeed Insights later that year.
Since Safari 26.2 (December 2025) every major browser can measure INP, although WebKit's first implementation has been reported to give some unrealistically high values. Google's field data, the Chrome UX Report, still comes only from Chrome.
The three phases of an interaction
Every interaction has three parts, and INP is their sum:
- Input delay: the tap arrives, but the browser is busy with something else (a script parsing, a tag firing, a timer). The handler waits.
- Processing duration: your event handlers run. Everything they do, including code added by analytics or tag managers listening to the same click, counts.
- Presentation delay: the browser recalculates styles, lays out the page and paints the new frame. A huge DOM or a handler that changed a lot of layout makes this long.
The browser can only do one of these things at a time on the main thread. Anything that holds the main thread for a long stretch, a long task of more than 50 ms, delays whatever interaction lands during it.
Why lab tests show TBT instead of INP
A lab tool like Lighthouse loads the page once and never taps anything, so there is no interaction to measure. It reports Total Blocking Time instead: the total time, during the load, that long tasks blocked the main thread beyond 50 ms each. A page with 1,200 ms of TBT would have ignored a tap for much of its load.
TBT and INP usually move together, but not always. TBT only covers the load; INP covers the whole visit, including interactions that run a lot of code (opening the mega menu, filtering 200 products, typing in a search box with live suggestions). A page can have a low TBT and still a poor INP if one specific interaction is slow.
How getReport checks it
The Core Web Vitals checker shows the three vitals for the page from real Chrome users next to a Lighthouse lab run. INP comes only from the field data; when Google has no data for the page or the origin, the finding says "not measured yet" as information and costs no points.
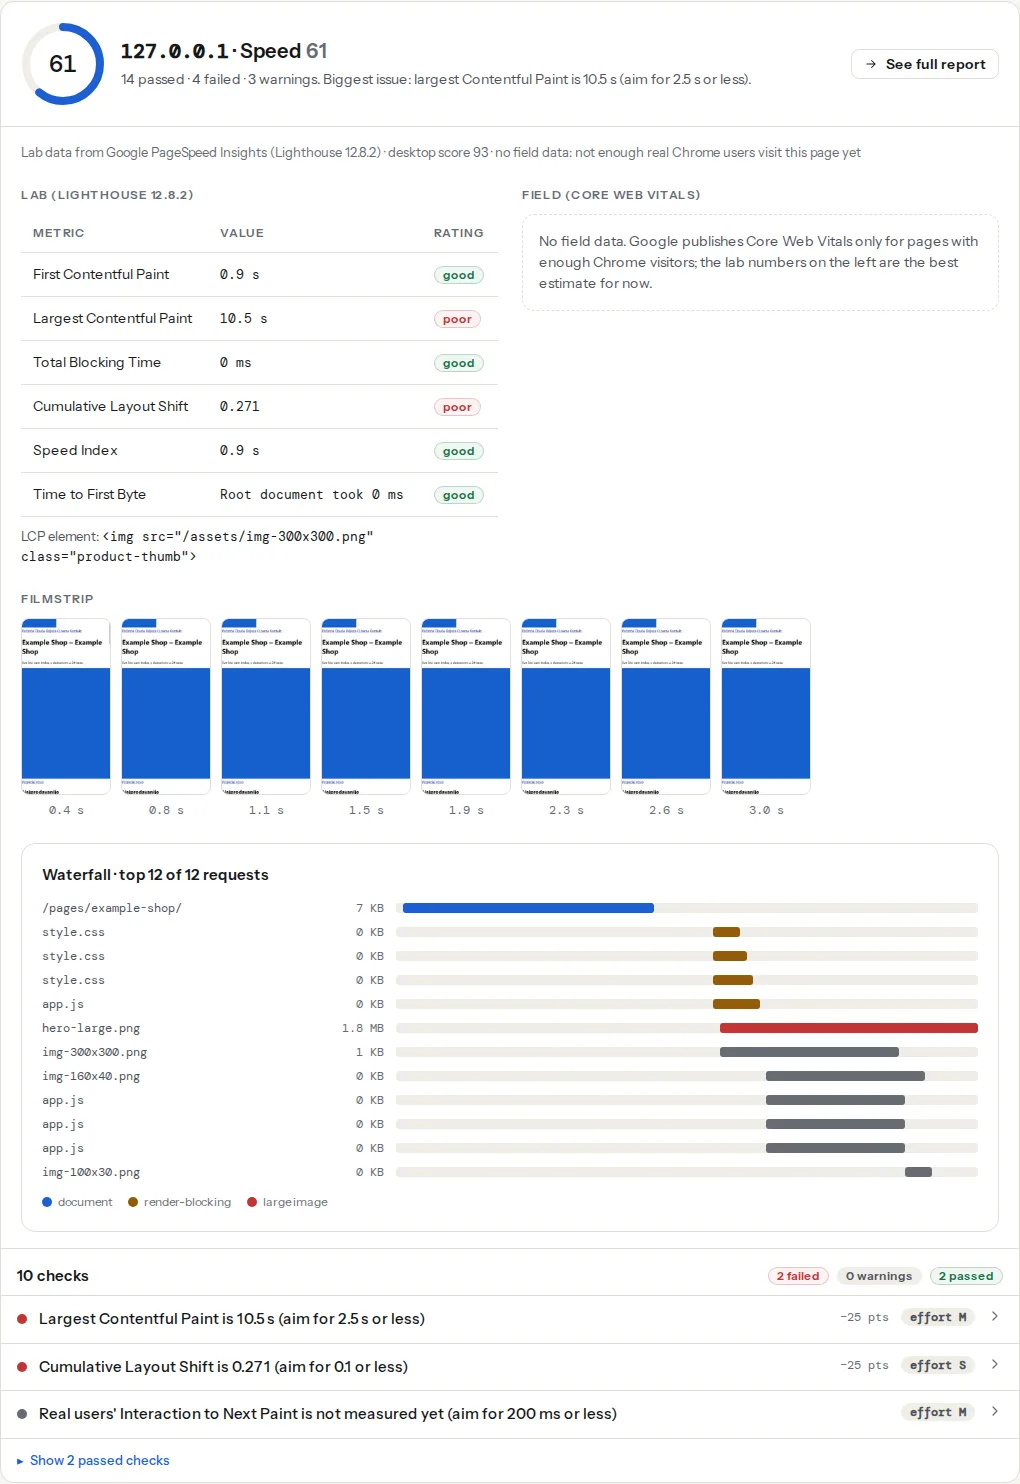
The speed test and the full report add the lab findings that explain a poor INP. Start with TBT, then the long tasks list, which names the scripts behind the longest tasks:
The third-party finding groups scripts by company (tag manager, chat, analytics, ads) with their size and blocking time. It is often the fastest route to a better INP, because removing a tag is easier than rewriting your own code.
How to improve INP, step by step
1. Find the slow interaction
Field data tells you INP is poor, not which interaction is slow. Two ways to find it:
In your browser. Open Chrome DevTools, go to the Performance panel, and set CPU throttling to 4× slowdown to behave like a mid-range phone. The live metrics view shows your own INP as you click around, with a log of each interaction. Try what visitors do: open the menu, pick a size, add to cart, filter, search. When one is slow, record it and look for the long task under the interaction.
From real visitors. Google's web-vitals library reports INP with attribution: which element was interacted with and how long each phase took. Add it to your main bundle and send the result to your own endpoint:
// main.js (bundled): report INP with attribution
// npm install web-vitals
import { onINP } from 'web-vitals/attribution';

onINP(({ value, rating, attribution }) => {
  const body = JSON.stringify({
    inp: Math.round(value),                  // ms
    rating,                                  // 'good' | 'needs-improvement' | 'poor'
    target: attribution.interactionTarget,   // CSS selector of the element
    inputDelay: Math.round(attribution.inputDelay),
    processing: Math.round(attribution.processingDuration),
    presentation: Math.round(attribution.presentationDelay),
  });
  navigator.sendBeacon('/api/vitals', body);   // your own endpoint
});
After a few days the slowest targets and the dominant phase are obvious. A long input delay points at something else running (tags, timers); long processing points at the handler; long presentation points at DOM size and layout.
2. Show the response first, then do the work
The next paint is what INP waits for. If the handler updates the UI and then runs 300 ms of calculation, the visitor sees nothing for 300 ms. Make the visual change, let the browser paint, then continue:
// A helper that hands control back to the browser
function yieldToMain() {
  if (globalThis.scheduler?.yield) {
    return scheduler.yield();
  }
  return new Promise((resolve) => setTimeout(resolve, 0));
}

addToCartButton.addEventListener('click', async () => {
  addToCartButton.classList.add('is-loading');   // visible at once
  addToCartButton.disabled = true;
  await yieldToMain();                           // the browser paints here
  await updateCart();                            // the heavy work
  addToCartButton.classList.remove('is-loading');
  addToCartButton.disabled = false;
});
scheduler.yield() is available in Chrome and Edge 129+ and Firefox 142+, but not in Safari, so keep the setTimeout fallback. The difference is that scheduler.yield() resumes your code before other queued tasks, so the work finishes sooner.
3. Break up long tasks
A loop that processes 500 products, renders a long list or parses a big JSON response in one go is one long task. Split it and yield between chunks:
// Process items in chunks of about 50 ms, yielding in between
async function processInChunks(items, handle) {
  let lastYield = performance.now();
  for (const item of items) {
    handle(item);
    if (performance.now() - lastYield > 50) {
      await yieldToMain();
      lastYield = performance.now();
    }
  }
}
Work that has nothing to do with the screen (sorting data, heavy calculations) can move to a Web Worker, which runs off the main thread entirely.
4. Avoid layout thrashing
Reading a layout value (offsetHeight, getBoundingClientRect()) right after changing a style forces the browser to lay out the page immediately. In a loop, that means one full layout per item:
// Slow: read, write, read, write… forces a layout on every item
cards.forEach((card) => {
  card.style.height = `${card.offsetWidth * 0.75}px`;
});

// Fast: read everything first, then write everything
const widths = cards.map((card) => card.offsetWidth);
cards.forEach((card, i) => {
  card.style.height = `${widths[i] * 0.75}px`;
});
Often CSS can do the job instead (here, aspect-ratio: 4 / 3), with no script at all. Lighthouse 13 flags this pattern as the "Forced reflow" insight.
5. Cut and delay third-party scripts
Third-party scripts hurt INP twice: their timers create input delay, and many of them (analytics, heatmaps, tag manager click triggers) attach their own listeners to your clicks, adding processing time. For each entry in the third-party finding, ask what it gives you:
- Nobody looks at it (an old heatmap, a second analytics tool): remove it.
- Needed, but not at load (chat, reviews, video): load it on interaction or behind a facade, a static button or thumbnail that loads the real widget when clicked.
- Needed at load (consent, analytics): load it with
asyncordefer, and keep tag manager tags to the ones in use.
The third-party scripts learn page has more on facades.
6. Defer non-critical JavaScript and keep the DOM small
Scripts that run during the load compete with the first taps: add defer to everything not needed for the first paint, and remove scripts from pages that do not use them. Large DOMs make every style recalculation and layout slower, which lengthens the presentation phase of every interaction. Page builders nesting five wrappers per element and menus rendered twice (mobile and desktop) are the usual causes. For long pages, content-visibility: auto on below-the-fold sections lets the browser skip their rendering work until they are near the viewport.
If a developer does these fixes, send them the report link with the long-tasks and third-party findings; how to send fixes to your developer shows what to include.
Platform notes
WordPress
- Page builders add large DOMs and a lot of JavaScript to every page. Use the builder's own performance settings (optimised DOM output, loading only the used widgets' assets) and avoid nesting sections inside sections.
- Plugins that add a script to every page add main-thread work even where they do nothing. A script manager (Perfmatters, Asset CleanUp) can disable them per page.
- "Delay JavaScript execution" in WP Rocket, Perfmatters and similar plugins holds scripts until the first interaction. It lowers TBT dramatically, but all delayed scripts then run the moment the visitor first taps, which can make that interaction slow. Exclude the scripts the first interaction needs (the menu, the cart) and check field INP afterwards.
WordPress Core Web Vitals covers plugins, themes and hosting in more depth.
Shopify
Apps inject their scripts into every storefront page. Uninstall apps you no longer use, and check the theme code afterwards: some leave script tags behind in theme.liquid.
Verify
- Re-run the lab test: TBT should be under 200 ms and the long-tasks list shorter.
- In DevTools with 4× CPU throttling, the interactions you fixed should show under 200 ms in the live metrics view.
- The field INP in the Core Web Vitals checker and Search Console follows over the next 28 days. How to improve Core Web Vitals covers the order for all three vitals.
Common mistakes
- Testing on a fast laptop. Symptom: every interaction feels instant to you, but field INP is poor. Fix: throttle the CPU 4× in DevTools.
- Only fixing load-time JavaScript. Symptom: TBT is fine, INP still fails. Fix: find the slow interaction (menu, filter, search) and fix its handler.
- Adding a spinner after the work. Symptom: the loading state never appears. Fix: set it, yield, then do the work.
- Measuring with heavy monitoring scripts. Symptom: INP gets worse after adding a performance tool. Fix: use the small
web-vitalslibrary or rely on CrUX.
Questions people ask
What is INP?
INP, Interaction to Next Paint, is Google's Core Web Vital for responsiveness. It measures how long a page takes to show a visual response after a click, tap or key press, using one of the slowest interactions of each visit. 200 ms or less at the 75th percentile of real visits is good, over 500 ms is poor. It usually fails because JavaScript keeps the browser's main thread busy.
Can a page have a good Total Blocking Time and a poor INP?
Yes. Total Blocking Time only measures long tasks during the page load in a lab run, while INP measures real interactions during the whole visit. A page that loads quietly but runs heavy code when a visitor opens the menu, filters products or types in search will have a low TBT and a poor INP. Find the slow interaction in DevTools with CPU throttling, then fix its handler.
Which interactions count towards INP?
Clicks, taps on a touchscreen and key presses, including typing in form fields. Hovering and scrolling do not count, though a scroll that triggers heavy JavaScript can still delay the next tap. The whole visit counts, not just the load, so an add-to-cart button, a size picker or a search box used a minute after the page loaded can decide the page's INP.