A browser tab has one main thread, and it does everything: runs your JavaScript, calculates styles, lays out the page, paints it, and handles every tap and scroll. It does one thing at a time. While a script runs for 400 ms, a tap that arrives 10 ms in waits 390 ms for an answer, and the visitor decides the button is broken. This guide is about those 400 ms: what a long task is, how the report finds the scripts behind each one, and the order of fixes that shrinks them, from deleting code to splitting it into pieces the browser can breathe between.
Quick answer
- A long task is any piece of main-thread work over 50 ms. During it, the page cannot respond.
- The lab metric is Total Blocking Time (everything over 50 ms per task, added up; aim under 200 ms). The field metric is Interaction to Next Paint (aim under 200 ms).
- The speed test's long-tasks finding names the scripts; DevTools → Performance shows them as red-flagged blocks.
- Fixes in order: remove scripts nobody needs,
deferthe rest, split bundles so pages load only their code, break loops up withscheduler.yield(), move heavy computation to a web worker. - On WordPress, most long tasks come from sliders, builders and tag managers; a "delay JavaScript" option helps the lab number, but check the field INP after.
Why long tasks matter
The 50 ms line comes from how people perceive delay. A response within about 100 ms feels instant. If the thread is busy for at most 50 ms at a stretch, any input that arrives can be handled within the next 50 ms, so the 100 ms budget holds. A single 300 ms task breaks it for everyone who taps during it.
Two metrics count the damage. Total Blocking Time is the lab number: for every long task between the first paint and the page becoming idle, take the part over 50 ms, and add them up. Three tasks of 80, 250 and 400 ms give 30 + 200 + 350 = 580 ms of TBT, well past the 200 ms Lighthouse counts as good, and TBT is the heaviest-weighted metric in the Lighthouse performance score. Interaction to Next Paint is the field number, from real Chrome visitors: the delay between a tap and the next frame, at the 75th percentile of visits, taking one of the worst interactions per visit. INP is a Core Web Vital and a ranking signal; TBT is the closest thing the lab can measure without a visitor to tap.
Long tasks come from ordinary things. A 600 KB JavaScript bundle takes 300–800 ms just to parse and compile on a mid-range phone before a line of it runs. A jQuery plugin that walks the whole DOM on DOMContentLoaded, a slider initialising eight slides, a tag manager firing fifteen tags in one go, a framework hydrating a page it already rendered on the server: each is a task, and each is long on a phone that is four times slower than the laptop it was tested on.
How getReport checks it
The speed module reads three Lighthouse audits from the same throttled mobile run. "Avoid long main-thread tasks" lists each task over 50 ms with the script that started it, up to 20 of them; "Minimize main-thread work" breaks the total thread time into categories; and Total Blocking Time is the metric that scores the result. The field INP comes from the Chrome UX Report when the page or origin has enough traffic:
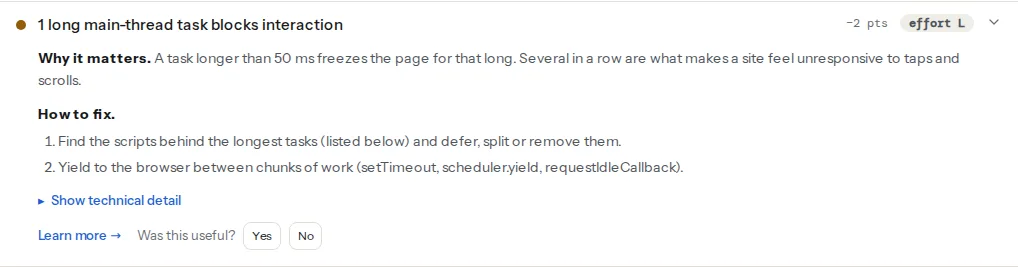
The technical line under the long-tasks finding is the list to work from; the main-thread finding's category breakdown tells you whether the time is script (usual) or style and layout (a DOM-size problem, covered in DOM size: why 3,000 nodes is a problem). "Unattributable" tasks are the browser's own work, typically parsing a huge HTML document, and they shrink when the page does.
Step by step
1. See the tasks yourself
The finding gives you names; the Performance panel gives you the shape. In Chrome DevTools → Performance, set CPU throttling to "4× slowdown" (the gear icon), press record, reload the page, stop after it settles. In the "Main" track, long tasks are the grey blocks with a red triangle in the corner and red hatching on the part over 50 ms. Click one: the Summary tab at the bottom says what ran, and the Bottom-Up tab, grouped by script URL, lists which files consumed the most time across the whole recording.
Record a second time, and this time click the thing visitors click most (the menu, a filter, "Add to cart"). A long task under that click is the one that sets your INP.
2. Remove what does not need to run
Before optimising anything, delete. Scripts that load on every page for a feature on one page (the contact form's validation, the product gallery's zoom, the map on the About page). Two copies of jQuery. A polyfill bundle for browsers the site no longer supports. Third-party tags with no owner (the third-party guide has the procedure). Every removed file is a task that no longer exists, and this step alone often halves TBT.
3. Defer what runs too early
A script in <head> without attributes runs the moment it arrives, in the middle of parsing, on the critical path to the first paint. defer moves its execution to after the HTML is parsed, in document order; async runs it whenever it arrives, for scripts that do not depend on the DOM or each other:
<!-- Before: blocks parsing and runs before the page exists -->
<script src="/js/app.js"></script>

<!-- After: downloads in parallel, runs after parsing, in order -->
<script defer src="/js/vendor.js"></script>
<script defer src="/js/app.js"></script>
Deferring does not shorten a task; it moves it. The gain is that the first paint and the LCP no longer wait behind it. For work that can wait until the browser is idle (analytics initialisation, prefetching, a "recently viewed" widget), requestIdleCallback hands it a slot when nothing else is pending:
// Run non-urgent setup when the browser has nothing better to do
requestIdleCallback(() => initRecentlyViewed(), { timeout: 3000 });
4. Split the bundle so each page loads its own code
One app.js with every feature means every page parses and compiles code for features it does not have. Bundlers split on dynamic import(): the code inside is a separate file, fetched and compiled only when the line runs:
// The gallery is only needed when the visitor opens it
document.querySelector('.gallery-open')?.addEventListener('click', async () => {
  const { openGallery } = await import('./gallery.js');
  openGallery();
});
The same applies to the framework level: route-based splitting in Next.js, Nuxt and SvelteKit is on by default, and the trap is importing a heavy library (a chart, a date picker, a rich text editor) at the top of a shared layout instead of in the page that uses it.
5. Break long work into pieces
Some work has to happen: rendering 200 search results, applying a filter to a product list, initialising a page of widgets. A loop that does it in one go is one long task. The same loop that yields to the browser every 50 ms is many short ones, and a tap that arrives in between gets handled at once:
// Yield to the main thread; scheduler.yield() where the browser has it, setTimeout elsewhere
function yieldToMain() {
  if (globalThis.scheduler && typeof scheduler.yield === 'function') {
    return scheduler.yield();
  }
  return new Promise((resolve) => setTimeout(resolve, 0));
}

// Initialise widgets in chunks of about 50 ms
async function initWidgets(widgets) {
  let deadline = performance.now() + 50;
  for (const widget of widgets) {
    widget.init();
    if (performance.now() > deadline) {
      await yieldToMain();
      deadline = performance.now() + 50;
    }
  }
}
scheduler.yield() is the purpose-built version: it puts the continuation at the front of the queue, so your work resumes right after any input has been handled, instead of behind everything else a setTimeout competes with. Not every browser has it yet, which is what the fallback is for.
The same idea applies to event handlers. Show the response first, then do the work: toggle the "added" state on the button, yield, then update the mini-cart, the recommendations and the analytics call.
6. Move heavy computation off the thread
Sorting 5,000 rows, filtering a large catalogue client-side, resizing an image before upload, parsing a big JSON file: none of it touches the screen, so none of it needs the main thread. A Web Worker runs in parallel and reports back with a message:
// main.js — send the data, render when the worker answers
const worker = new Worker('/js/filter-worker.js');
worker.addEventListener('message', (event) => renderResults(event.data));
worker.postMessage({ products, query: 'running' });// filter-worker.js — no DOM access, just the work
self.addEventListener('message', (event) => {
const { products, query } = event.data;
const matches = products.filter((p) => p.name.toLowerCase().includes(query));
self.postMessage(matches);
});The worker's task can be as long as it likes; the main thread stays free for taps and scrolls the whole time.
7. Hydrate less
Sites built with React, Vue or Svelte and rendered on the server ship HTML that looks finished, then run the framework to attach behaviour to it (hydration). On a large page, hydration is often the single longest task: it walks the whole tree and re-creates every component. The frameworks' answers are partial hydration and islands (Astro, Fresh), server components that ship no JavaScript for static parts (React Server Components in Next.js), and startTransition or lazy hydration for components below the fold. The measure of success is simple: the JavaScript bundle for a content page should be a fraction of the one for the interactive checkout.
Platform notes
WordPress
Three scripts core loads on every page can go on most sites. The emoji detection script and the oEmbed script are small but run early; jQuery Migrate is 10 KB that exists for plugins written before 2016. In functions.php or a small plugin:
// Stop the emoji detection script and styles
add_action('init', function () {
    remove_action('wp_head', 'print_emoji_detection_script', 7);
    remove_action('wp_print_styles', 'print_emoji_styles');
});

// Stop the oEmbed script (embedding other WordPress posts)
add_action('wp_footer', function () {
    wp_dequeue_script('wp-embed');
});

// Drop jQuery Migrate on the front end; test the site afterwards, old plugins may need it
add_action('wp_default_scripts', function ($scripts) {
    if (!is_admin() && isset($scripts->registered['jquery'])) {
        $scripts->registered['jquery']->deps = array_diff($scripts->registered['jquery']->deps, ['jquery-migrate']);
    }
});
The bigger tasks come from plugins: Slider Revolution and other sliders initialising every slide, page builders' frontend scripts, animation add-ons, and a tag manager container with too many tags. The plugin cost table shows what each one loads; Perfmatters or Asset CleanUp can then disable a plugin's scripts on the pages that do not use it.
"Delay JavaScript execution" in WP Rocket, Perfmatters and LiteSpeed Cache holds listed scripts until the first interaction. It removes the tasks from the load, so TBT drops, but it runs all of them at the first tap, which can make that tap slow. Exclude the scripts the first interaction needs (menu, cart, search) and confirm with the field INP a month later.
Shopify
Apps are the usual source. Each installed app can inject a script on every page; uninstall what you do not use and check theme.liquid and the "App embeds" list for leftovers. Theme JavaScript in Dawn is already split per section and loaded with defer.
Static sites and frameworks
Use the framework's bundle analyser (next build prints per-route sizes; vite-bundle-visualizer and webpack-bundle-analyzer draw the treemap) and start with the largest chunk on the most visited page. A content page should ship under 100 KB of compressed JavaScript; over 300 KB, hydration is almost certainly your longest task.
Verify
- Re-run the speed test. The long-tasks finding shows fewer tasks and a lower total, and the ones left name your own code. Total Blocking Time should be under 200 ms on the mobile run; keep the previous report link for the before/after.
- Record the Performance panel again at 4× CPU throttling: no red-flagged block over 100 ms during the load, and the click you recorded in step 1 shows a short task followed by a paint.
- After 28 days, the Core Web Vitals checker shows the field INP at the 75th percentile; that is the number Google uses, and it moves only when real visitors' taps got faster.
Common mistakes
- Optimising the laptop. A task that is 60 ms on a MacBook is 250 ms on a mid-range Android phone. Always measure with CPU throttling, and trust the report's mobile run over a desktop test.
- Deferring a script and calling it done. The task is the same length; it just runs later. If it still runs before the visitor's first tap, INP does not change. Remove, split or chunk it too.
- Yielding with
setTimeoutinside a hot loop on every iteration. Yielding costs a few milliseconds each time; yield every 50 ms of work, not every item. - Moving DOM work to a worker. Workers cannot touch the DOM. Send them the data, not the elements, and render the result on the main thread in a short task.
- Delaying all JavaScript on WordPress, including the menu. The lab score jumps and the first tap on the phone freezes for a second. Exclude what the first interaction needs.
- Reading TBT as INP. TBT is a lab estimate during load; INP is a field measure over the whole visit, including a slow "Add to cart" ten seconds in. A page can pass one and fail the other; check both findings.