Two of the six numbers in a speed test describe the same moment from two angles: the moment the blank page stops being blank. First Contentful Paint is a timestamp, the instant the first text or image lands on screen. Speed Index is a shape, how quickly the whole visible area filled in after that. Neither is a Core Web Vital, neither is used for ranking, and both are worth twenty points of the Lighthouse score between them, which is why they are worth understanding. This guide explains what each one measures, why the lab is the only place they exist, and the fixes that move them, in order.
Quick answer
| Metric | What it measures | Good | Poor | Weight in the score |
|---|---|---|---|---|
| First Contentful Paint (FCP) | The first text, image, canvas or SVG painted | ≤ 1.8 s | > 3.0 s | 10 % |
| Speed Index (SI) | How quickly the visible area became visually complete | ≤ 3.4 s | > 5.8 s | 10 % |
- FCP is decided by what happens before any pixel: server response, redirects, render-blocking CSS and JavaScript, and fonts that hide text.
- Speed Index is decided by what happens after the first pixel: above-the-fold images, lazy-loaded heroes, skeleton screens, sliders and client-side rendering.
- Fix FCP first (it is the floor of every other metric), then look at the filmstrip for Speed Index.
- Run the speed test; both numbers are in the lab table, next to LCP.
Why FCP and Speed Index matter
A visitor who taps a link and sees nothing has no way to tell whether the page is loading or the network is dead. Research on abandonment is consistent: the first second of blank screen is tolerated, the third is not. FCP is the number for that: the wait before there is anything. Every other metric starts after it, so a 2.5 s FCP guarantees an LCP over 2.5 s before a single image is involved.
Speed Index catches a different failure. A page can paint its header at 1.2 s and then show a grey skeleton for three more seconds while JavaScript fetches the products, or paint everything except the hero, which pops in at 4 s. FCP is fine in both cases and the visitor still waits. Speed Index measures the average time at which the visible parts of the page were displayed, so it penalises a page that is technically "painting" but not actually showing content.
Neither metric is part of Google's page experience signal. That is because they cannot be measured on real visitors: FCP can (Chrome reports it, and the Chrome UX Report publishes it), but Google chose LCP as the loading vital because "first pixel" is too easy to game with a spinner. Speed Index needs a video of the load and only exists in a lab. They are diagnostic numbers: they tell you why LCP is what it is.
How each one is computed
FCP is a browser timestamp: the first time the renderer paints anything that counts as content, in Google's definition: text (including text in a web font that has arrived), an <img>, an SVG, a <canvas> with something drawn on it. A background colour does not count; a border does not count. A page that paints a white header bar with a logo at 0.9 s has an FCP of 0.9 s even if the rest is blank.
Speed Index comes from the filmstrip. Lighthouse records the load as video, compares every frame to the final frame to compute how "visually complete" the viewport is at that moment (0 % to 100 %), and integrates the incompleteness over time. A page that goes from 0 % to 100 % at 1.5 s in one step has a Speed Index of 1.5 s. A page that reaches 80 % at 1.5 s and 100 % at 6 s has a Speed Index somewhere around 2.4 s, because most of the area was there early. The number is in milliseconds but it is an average, not a moment.
How getReport checks it
The speed module asks Google's PageSpeed Insights for a Lighthouse run of the page (mobile by default, a simulated slow 4G connection and a 4× slower CPU) and shows the six lab metrics as one table, each with its value and a good, needs-improvement or poor rating. FCP and Speed Index sit next to LCP, Total Blocking Time, CLS and TTFB so you can read them as a sequence rather than in isolation:
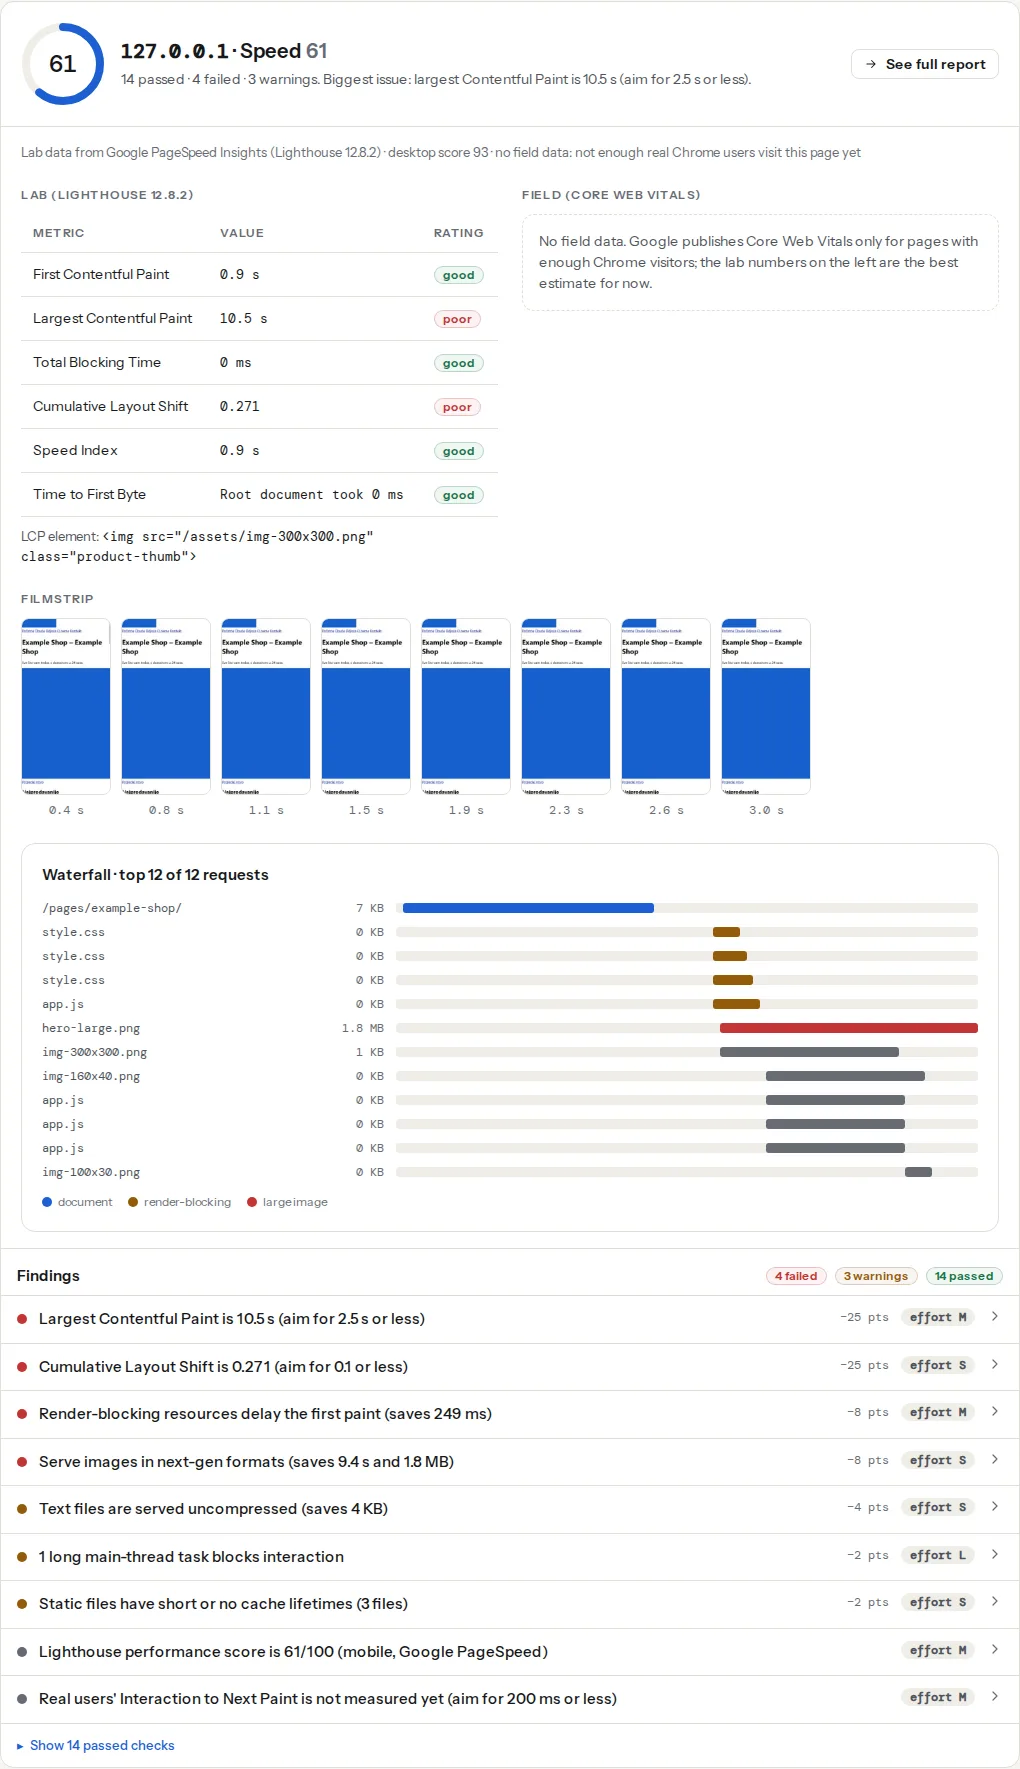
Below the table the filmstrip shows what the screen looked like at each moment, which is the Speed Index made visible. The four findings that matter for these metrics:
The ttfb and fcp rows are rated against Google's thresholds; the render-blocking finding lists the files between the first byte and the first paint with the delay Lighthouse estimates for each.
Step by step
1. Subtract TTFB from FCP
FCP includes the server response. If TTFB is 1.4 s and FCP is 2.1 s, the page itself is doing fine (0.7 s from HTML to paint); the server is the problem, and no CSS change will fix it. See TTFB: what a slow server looks like. If TTFB is 0.2 s and FCP is 2.1 s, 1.9 s went into render-blocking files and fonts; continue here.
Redirects count too. Every hop before the page (http:// → https:// → www. → trailing slash) is a full round trip on the lab's 150 ms connection, plus a new TLS handshake for the http:// hop. The redirects-chain finding lists them.
2. Clear the path to the first paint
Between the HTML arriving and the first pixel, the browser must download and parse every stylesheet in <head> and every script without defer or async. The render-blocking finding lists them with an estimated saving. The fixes, from cheapest:
<!-- Scripts not needed for the first paint: defer keeps order, async does not -->
<script src="/js/app.js" defer></script>
<script src="https://www.googletagmanager.com/gtag/js?id=G-XXXX" async></script>

<!-- Stylesheets only needed later: load without blocking -->
<link rel="stylesheet" href="/css/below-the-fold.css" media="print" onload="this.media='all'">
For the main stylesheet the honest options are to make it smaller (remove unused rules, split per template) or to inline the rules needed for the first screen and load the rest asynchronously. Both are covered in Render-blocking resources. A page with one 40 KB stylesheet and no blocking scripts paints within one round trip of the HTML.
3. Let text paint before the font arrives
Web fonts are the most common reason FCP is later than the CSS timing suggests. Without font-display, browsers hide text in a web font for up to 3 s while it downloads, and hidden text is not a contentful paint. If the only content above the fold is text (a headline and a paragraph), FCP is the font's arrival time.
@font-face {
  font-family: "Instrument Sans";
  src: url("/fonts/instrument-sans-var.woff2") format("woff2");
  font-weight: 400 700;
  font-display: swap; /* paint in the fallback font now, swap when the web font arrives */
}
For Google Fonts, add &display=swap to the stylesheet URL. Then preload the one or two fonts used in the first screen so the swap happens early or not at all: see Web fonts without layout shift.
4. Compress and shorten the HTML
The first paint cannot happen until enough HTML has arrived to render something. A 300 KB uncompressed HTML document (page builders and inline SVG icons produce these) takes over a second on the lab connection before the parser reaches the content. Brotli or gzip cuts it by 70–80 %; the brotli-or-gzip finding checks it. Also look for large inline <style> and <script> blocks in <head>: inlining 200 KB of CSS "to avoid a request" moves the delay into the HTML.
5. Now read the filmstrip for Speed Index
With FCP under control, open the filmstrip. Each frame is a moment; find the frame where the page first looks like the final one. The gap between the first non-blank frame and that frame is what Speed Index measures. Common shapes, and what each means:
- Header at 1 s, everything else at 4 s. The content is rendered by JavaScript after an API call. Fix: server-render the first screen (the HTML should contain the products, not a
<div id="app">), or at least the above-the-fold part. - Everything except the hero image, then the image at 3.5 s. The hero is lazy-loaded, set in CSS, or loaded by a slider script. Fix: a real
<img>in the HTML withfetchpriority="high"and noloading="lazy"; see Lazy loading done right. - Grey boxes (a skeleton) for two seconds, then content. Skeleton screens count as painted area, so they lower FCP and raise Speed Index (the final frame has no grey boxes, so those frames are "incomplete"). A skeleton is only worth it when the real content genuinely cannot be in the HTML.
- A slider that cycles through slides during the load. Every slide change is a visual change, so the page never looks "complete" until the animation settles. Fix: do not autoplay during load, or make the first slide static.
- Text appears, then jumps into a new font. The swap is a visual change too. A preloaded font or a metric-compatible fallback (
size-adjust) keeps it small. - A cookie banner slides in at 2.5 s. The banner covers part of the viewport and changes the frame. Render it in the HTML from the start rather than injecting it after a script loads.
6. Check that above-the-fold images are sized and early
Speed Index is a viewport metric, so only what is on screen at 412 × 823 px (the lab's phone viewport) counts. A category page with six product images in the first screen fills in as fast as the slowest of them. Give each an srcset so the phone downloads a 400 px file and not a 1600 px one, keep them as <img> in the HTML, and do not lazy-load the first row. The images-heavy-files and image-sizing findings list the heavy ones.
Platform notes
WordPress
The usual FCP causes are, in order: no page cache (TTFB), the theme and page builder enqueueing ten stylesheets in <head>, a Google Fonts stylesheet without display=swap, and a jQuery-dependent script in the head. A caching plugin with "Load CSS asynchronously" or "Remove unused CSS" and "Load JavaScript deferred" (WP Rocket; LiteSpeed Cache has the equivalents under Page Optimization) handles the middle two. For Speed Index, the offenders are sliders (Slider Revolution, Elementor's carousel) as the hero and lazy-loading plugins that lazy-load the first image. Replace the slider with one static image and exclude the hero from lazy loading.
Shopify
TTFB and compression are the platform's and already good. FCP is usually the theme's <script> tags in theme.liquid without defer and apps that inject scripts into <head>; the theme editor's "App embeds" list shows which ones you can turn off. Speed Index is the hero: use a section with a static image rather than a slideshow on the home page.
Static sites and custom
If FCP is high on a static site, it is almost always fonts or a large blocking script bundle. For Speed Index on a JavaScript app, the question is whether the first screen is in the HTML: view the page source and search for a headline you see on screen. If it is not there, the framework is rendering on the client and every visitor waits for the bundle; static generation or server rendering for the entry pages is the fix.
Verify
- FCP under 1.8 s and Speed Index under 3.4 s on the mobile run, with the
fcpandspeed-indexrows rated good. - The filmstrip shows the first non-blank frame and the "looks complete" frame close together, within one or two frames.
- The render-blocking finding passes or lists only the main stylesheet.
- Run the test three times; FCP should agree within about 200 ms. A larger spread points at the server or a third party, not at the page.
- LCP moved with it. If FCP improved and LCP did not, the LCP element itself is the next job: How to fix Largest Contentful Paint.
Common mistakes
- Optimising FCP with a spinner. A loading animation is a contentful paint, so FCP looks great and the visitor still sees nothing useful. Speed Index and LCP get worse. Paint real content or nothing.
- Inlining all the CSS. FCP improves on the first visit and every later page view downloads the CSS again inside the HTML, uncached. Inline the first-screen rules only (10–20 KB), keep the rest as a cached file.
- Adding a skeleton screen to "feel faster". The frames with grey boxes count as incomplete, Speed Index rises, and the real fix (content in the HTML) is postponed.
- Reading Speed Index on desktop. The desktop viewport is 1350 px wide and shows more of the page; a hero that is 80 % of the phone screen is 30 % of the desktop one. Judge on the mobile run, the one Google uses.
- Chasing the last 200 ms of FCP while TTFB is 1.2 s. The server sets the floor; page caching moves FCP by a second in one setting. Check TTFB first.