A site gets slow the way a room gets untidy: one chat widget, one hero video, one more font, each of them reasonable on its own. A speed budget is the line you agree not to cross, written down, and checked by a machine on every change. This guide shows how to pick numbers you can defend, how to hold them in CI without false alarms, and what to do on the day a pull request breaks them. Setting it up takes an afternoon; keeping it costs a few minutes a month.
Quick answer
- A budget is a limit on a metric (LCP under 2.5 s on a mid-range phone), a quantity (JavaScript under 300 KB, images under 1 MB, at most 5 third parties) or a rule (no synchronous script in
<head>). - Start from where you are: run the speed test on one page per template and read the field p75 in the Core Web Vitals history. Set each budget at the current value minus a margin and tighten it quarterly.
- Enforce quantities as errors (bytes and request counts are stable between runs) and metrics as warnings (lab timings vary run to run).
- Use Lighthouse CI with
assertionsor abudgets.json, run 3–5 times against a preview URL, and take the median. - Keep the budget file in the repo, with a named owner for every increase.
- getReport is the monthly human check; Lighthouse CI is the per-commit machine check. The getReport API is announced for a later milestone and is not live, so do not plan a CI step on it yet.
Why a speed budget matters
Without a budget, every speed fix is temporary. Someone spends a week getting LCP to 2.1 s, and six months later the marketing team has added a video background, a review carousel and two tracking pixels, and it is 3.8 s again. Nobody did anything wrong; nobody was watching the total. The 40-week Core Web Vitals history of most sites shows exactly this shape: a dip after a fix, then a slow climb.
A budget turns speed from a project into a property of the site. It also changes the conversation. "Can we add the chat widget?" becomes "The chat widget costs 180 KB and 90 ms of blocking; the third-party budget has 60 KB left, so what comes out?" A marketer and a developer can settle that in a minute. The number is not the point; the habit is. A generous budget that is enforced beats a strict one that is not.
How getReport checks it
The speed test runs Google's Lighthouse on a throttled phone and on desktop and shows the real-user Core Web Vitals from the Chrome UX Report beside the lab numbers. Four findings from it are the ones a budget is built on:
The score is an information finding with no weight in getReport's own scoring, and that is deliberate: it is a summary of the metrics, not a metric. Total Blocking Time is the lab stand-in for INP and the metric a JavaScript budget protects. The third-party finding lists each vendor with its transfer size and blocking time (up to ten), and warns when the total passes 250 KB or 250 ms of blocking. The image finding comes from the rendered page's requests, warns above 1.5 MB in total or 500 KB for a single file, and lists the largest files by URL. Those lists are where a broken budget gets a name.
For the field side, the Core Web Vitals history tool plots the weekly 75th percentile of LCP, INP and CLS for the whole origin, or one page, against Google's thresholds:
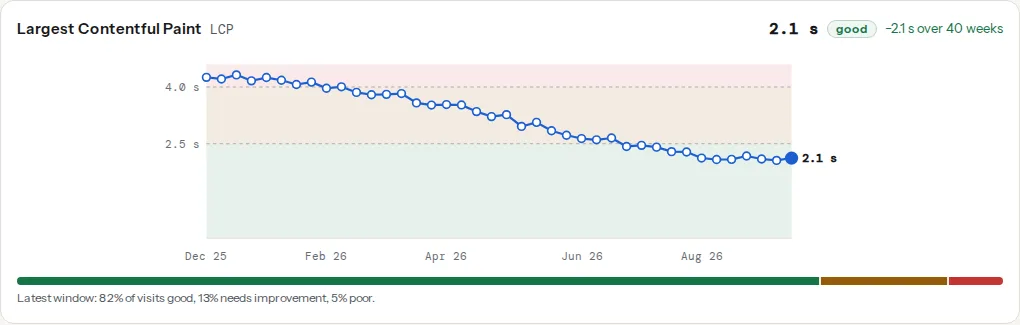
The field p75 is what Google ranks on and what your visitors felt. The lab number is what your CI can measure. A budget uses both: the field number decides what the target is; the lab number is how you catch a regression before it reaches the field.
Step by step
1. Decide which kind of budget you are setting
| Kind | Example | Stable in CI? | Use it as |
|---|---|---|---|
| Metric | LCP ≤ 2.5 s, TBT ≤ 200 ms, CLS ≤ 0.1 | No: lab timings vary between runs | Warning |
| Quantity | JS ≤ 300 KB, images ≤ 1 MB, ≤ 5 third-party origins, ≤ 60 requests | Yes: bytes and counts are the same every run | Error |
| Rule | No <script> without defer or async in <head>; no image above 500 KB in the repo | Yes | Error (lint) |
Metrics are what you care about. Quantities are what you can enforce. A page whose JavaScript stays under 300 KB and whose images stay under 1 MB rarely drifts past its LCP budget, and when it does, the cause is usually a server or a font, not a pull request.
2. Pick the numbers from your own report, not from a blog post
Run the speed test on one URL per template: home, a category or listing, a product or article, the checkout or contact page. For each, note the lab LCP, TBT and CLS, the field p75 for LCP, INP and CLS where the page or origin has field data, the JavaScript, image and third-party totals from the finding lists, and the number of third parties.
The starting budget is the current value with a margin: JavaScript at today's weight rounded up to the next 50 KB, third parties at today's count, LCP at the field p75 rounded up to the next 0.25 s. If the field LCP is 3.1 s, the budget is 3.25 s, not 2.5 s; a budget you break on day one gets disabled on day two. Write the quarterly target next to it (3.25 → 3.0 → 2.75 → 2.5) and tighten the file every three months.
Two rules that save arguments later:
- Use the field p75, not the best lab run, when setting metric budgets. Real visitors have slower networks and older phones than a data-centre Lighthouse run, and the p75 is what Google uses. Field data vs lab data explains the gap.
- One budget per template, not per site. The home page and the product page do not have the same job; a shared budget is either too loose for the home page or impossible for the product page.
3. Write the budget into the repo
Lighthouse reads budgets.json directly (lighthouse https://example.com --budget-path=budgets.json) and reports a "Performance budget" and a "Timing budget" audit. Sizes are in kilobytes, timings in milliseconds, and path chooses which URLs each block applies to. A marketing site:
[
  {
    "path": "/*",
    "resourceSizes": [
      { "resourceType": "script", "budget": 200 },
      { "resourceType": "image", "budget": 800 },
      { "resourceType": "font", "budget": 100 },
      { "resourceType": "third-party", "budget": 150 },
      { "resourceType": "total", "budget": 1500 }
    ],
    "resourceCounts": [
      { "resourceType": "third-party", "budget": 5 },
      { "resourceType": "total", "budget": 60 }
    ],
    "timings": [
      { "metric": "largest-contentful-paint", "budget": 2500 },
      { "metric": "total-blocking-time", "budget": 200 },
      { "metric": "cumulative-layout-shift", "budget": 0.1 }
    ]
  }
]
A shop, where the listing and product templates carry more script and more images, gets its own blocks:
[
  {
    "path": "/",
    "resourceSizes": [
      { "resourceType": "script", "budget": 300 },
      { "resourceType": "image", "budget": 1000 },
      { "resourceType": "third-party", "budget": 250 }
    ],
    "resourceCounts": [{ "resourceType": "third-party", "budget": 6 }],
    "timings": [{ "metric": "largest-contentful-paint", "budget": 2500 }]
  },
  {
    "path": "/products/*",
    "resourceSizes": [
      { "resourceType": "script", "budget": 350 },
      { "resourceType": "image", "budget": 1200 },
      { "resourceType": "third-party", "budget": 250 }
    ],
    "resourceCounts": [{ "resourceType": "third-party", "budget": 6 }],
    "timings": [
      { "metric": "largest-contentful-paint", "budget": 2750 },
      { "metric": "total-blocking-time", "budget": 300 }
    ]
  },
  {
    "path": "/checkout/*",
    "resourceSizes": [{ "resourceType": "third-party", "budget": 100 }],
    "resourceCounts": [{ "resourceType": "third-party", "budget": 3 }],
    "timings": [{ "metric": "total-blocking-time", "budget": 200 }]
  }
]
The checkout block is the one most shops forget: it is where a slow page costs the most and where "just one more" analytics tag lands first. Google's own guidance on the file format is in Use Lighthouse for performance budgets.
4. Run it in CI with Lighthouse CI
Lighthouse CI (@lhci/cli) collects several runs, aggregates them and asserts. lighthouserc.js at the repo root:
// lighthouserc.js — Lighthouse CI configuration
module.exports = {
  ci: {
    collect: {
      // Preview URL from the hosting provider, or a locally served build (see step 5)
      url: [
        `${process.env.PREVIEW_URL}/`,
        `${process.env.PREVIEW_URL}/products/runner-x/`,
        `${process.env.PREVIEW_URL}/checkout/`,
      ],
      numberOfRuns: 5,
      // Lighthouse's default is the throttled phone emulation. Leave it; do not switch to desktop.
    },
    assert: {
      // Compare the median of the 5 runs against the assertions, not the best or the worst
      aggregationMethod: 'median',
      assertions: {
        // Quantities: stable, so they fail the build
        'resource-summary:script:size': ['error', { maxNumericValue: 300 * 1024 }],
        'resource-summary:image:size': ['error', { maxNumericValue: 1000 * 1024 }],
        'resource-summary:third-party:count': ['error', { maxNumericValue: 6 }],
        // Metrics: noisy, so they warn and appear in the report
        'largest-contentful-paint': ['warn', { maxNumericValue: 2500 }],
        'total-blocking-time': ['warn', { maxNumericValue: 200 }],
        'cumulative-layout-shift': ['warn', { maxNumericValue: 0.1 }],
        'categories:performance': ['warn', { minScore: 0.9 }],
      },
    },
    upload: { target: 'temporary-public-storage' },
  },
};
The resource-summary:* assertions take bytes, not kilobytes, which is why the numbers are multiplied out. If you prefer to keep the budget in budgets.json, Lighthouse CI accepts it through assert.budgetsFile instead of the assertions block; keep one of the two so there is a single source of truth.
The GitHub Actions job, at .github/workflows/speed-budget.yml:
name: Speed budget
on: [pull_request]

jobs:
  lighthouse:
    runs-on: ubuntu-latest
    steps:
      - uses: actions/checkout@v4
      - uses: actions/setup-node@v4
        with:
          node-version: 22
      - run: npm ci
      - run: npx @lhci/cli autorun
        env:
          PREVIEW_URL: https://deploy-preview-${{ github.event.number }}--your-site.netlify.app
autorun runs collect, assert and upload in one go and exits non-zero when an error assertion fails, which is what marks the pull request red.
5. Point it at something real
Lighthouse needs a URL that serves the pull request's build, not main:
- Netlify deploy previews have a predictable address,
https://deploy-preview-<PR number>--<site>.netlify.app, which the workflow above uses. - Vercel preview URLs are unique per deployment; an action that waits for the deployment and outputs its URL feeds
PREVIEW_URL. - GitHub Pages and static builds skip the network: build in the job and let Lighthouse CI serve the folder with
collect.staticDistDir: './dist'in place ofurl.
Whichever you use, test the same pages every time; "whatever changed" makes the numbers incomparable.
6. Deal with the noise honestly
Two Lighthouse runs of the same page differ, sometimes by a few points, sometimes by more than ten, because the CI machine's CPU and network are shared and variable. Three things keep this from becoming a job everybody ignores:
- Run 3–5 times and assert on the median (
numberOfRuns,aggregationMethod: 'median'). One slow run then cannot fail the build. - Assert quantities as errors, metrics as warnings. Bytes and request counts do not depend on the machine; a 40 KB jump in script size is a real change with a real author. A 200 ms jump in LCP might be the runner.
- Watch the trend, not the run. The self-hosted Lighthouse CI server keeps the history and diffs against the base branch, which is how a slow drift becomes visible.
Tip
For the JavaScript budget alone, a bundle-size check is faster and quieter than a Lighthouse run. size-limit reads "size-limit": [{ "path": "dist/*.js", "limit": "300 kB" }] from package.json and fails npx size-limit when the built files exceed it; webpack's performance: { maxAssetSize: 300000, maxEntrypointSize: 300000, hints: 'error' } fails the build itself. Run these on every commit and Lighthouse CI on pull requests.
7. Budget the images where they enter
Images rarely arrive through a pull request; they arrive through the CMS. Two cheap gates. For a repo with an images folder, a check in the same workflow:
# Fail when any image over 500 KB is committed
big=$(find public/images -type f \( -name '*.jpg' -o -name '*.png' -o -name '*.webp' \) -size +500k)
if [ -n "$big" ]; then echo "Images over 500 KB:"; echo "$big"; exit 1; fi
For WordPress, reject oversized image uploads before they land in the media library, in a small plugin or the child theme's functions.php:
add_filter('wp_handle_upload_prefilter', function ($file) {
    if (str_starts_with($file['type'], 'image/') && $file['size'] > 500 * 1024) {
        $file['error'] = 'This image is over 500 KB. Resize or compress it before uploading.';
    }
    return $file;
});
Editors get a plain message at upload time instead of a slow page a month later. Pair it with an image optimisation plugin so the rule is easy to follow.
8. When the budget breaks
The failed assertion says which quantity grew and by how much, and the pull request's diff says who added what. When the cause is outside the diff:
- A third-party jump: run the speed test and open the third-party finding; it names the vendor, its bytes and its blocking time. Usually a tag manager container changed, which no pull request shows. Third-party scripts covers what to do with each kind.
- An image jump: the image finding lists the largest files by URL. Usually a new hero uploaded at camera size.
- A metric-only warning with no quantity change: re-run. If it holds across two more runs, look at the server (TTFB) and fonts before the code.
Then decide, in the pull request: revert, fix, or raise the budget. Raising it is allowed. Raising it silently is not.
9. Write down who can raise it
A budget lives in the repo next to the code, and the file's history is its audit trail. Add a CODEOWNERS line for budgets.json and lighthouserc.js so a change needs a review from whoever owns performance, and a comment at the top of the file with the quarterly targets and the date they were last tightened. That is the whole governance: a named owner, a review, a date.
Platform notes
WordPress
Most WordPress sites have no pull requests, so the machine check runs on a schedule instead: a Lighthouse CI job (on: schedule) against production once a day, with the same assertions. It does not block a change, but it tells you the morning after a plugin update pushed script weight over the line. The upload gate in step 7 is the half that prevents problems.
Shopify
The theme repo can run Lighthouse CI against a preview theme URL (?preview_theme_id=). Apps inject scripts outside the theme, so the third-party count is the budget that matters most, and it is enforced by whoever approves app installs, not by CI. See what you can and cannot fix on Shopify.
Static sites and custom builds
The easiest case: build in CI, serve with staticDistDir, assert. Hugo, Astro and Next.js builds are deterministic, so quantity budgets can be tight and the metric warnings mostly quiet.
Verify
- The workflow fails on a test pull request that adds a 400 KB script, and passes on
main. - The Lighthouse CI report link on a pull request shows five runs per URL and the median values.
- Once a month, run the speed test on the same three URLs and compare the third-party and image findings with the budget file, as part of the monthly site health routine.
- The Core Web Vitals history line for LCP stays inside the green band, and the "latest" chip does not move to amber after a release.
Common mistakes
- A budget nobody enforces. A number in a wiki changes nothing. If it is not in CI or in an upload rule, it is a wish.
- One budget for every template. The product page either breaks it every week or the home page gets away with anything. One block per template in
budgets.json. - Asserting the Lighthouse score. The score is a weighted blend that moves when Lighthouse changes its weights. Assert the metrics and quantities underneath; keep the score as a warning if you want it in the report.
- Measuring on desktop. Desktop scores are 20–40 points higher and hide every mobile problem. Lighthouse CI's default is the phone emulation; leave it there. Mobile vs desktop scores explains the gap.
- Failing the build on one run. A single slow runner then blocks a release, and the next step is someone disabling the job. Median of 3–5 runs, metrics as warnings.
- Expecting a getReport CI integration. The keyed API is announced for a later milestone and is not live. Use the web report and its permanent link as the monthly review, and Lighthouse CI as the gate.