The monthly routine catches breakage. The quarterly review answers a different question: is the site getting better or worse in search, and what are the three things worth doing next? This guide gives you the inputs to gather in about an hour, a template you can copy, how to read the trends without fooling yourself, and a 30-minute meeting that ends in decisions.
Quick answer
- Monthly is for catching what broke; quarterly is for judging direction and choosing next quarter's three projects. Keep the two separate.
- Gather in one hour: Search Console (clicks and impressions this quarter against the last, the Pages report, Core Web Vitals), a getReport report on the same 10 key pages as last quarter, the 40-week Core Web Vitals history, the sitemap, analytics landing pages and conversions.
- Fill in one document: a three-sentence summary, a scorecard per page, an indexation table, the carried-over debt, wins and regressions with causes, three projects, risks and the decisions you need.
- Read trends against seasonality, Google updates, redesigns and tracking changes before crediting any single fix.
- Archive the report links, the PDF and the review itself where the next reviewer will find them.
Why a quarterly review matters
A month is too short to see direction. Search Console clicks swing with weekdays, holidays and one lucky article; Core Web Vitals field data is a rolling 28-day window, so a fix shipped in week three barely shows by the end of the month. Over a quarter those swings average out and the real movement appears: the category pages that slowly lost impressions, the template that crossed from "needs improvement" into "good", the pile of "Crawled, currently not indexed" pages that doubled.
The other reason is decisions. A monthly check produces small fixes; nobody approves a template rebuild or a content consolidation from a monthly note. A quarterly review with numbers side by side is where "we should fix the product page LCP" becomes a project with an owner and a date. If you run the monthly site health routine, the quarterly review reuses its notes and does not repeat its steps.
How getReport checks it
Each report is a permanent link for 12 months, which is what makes quarter-on-quarter comparison work: last quarter's links still open, with the same findings you saw then. Run the same pages, on the same device, and put the two links next to each other.
Four findings anchor the review:
This is the first row of every page's scorecard. A key page that fails it has fallen out of search whatever the other numbers say; the technical detail tells you whether the cause is the status code, a noindex or robots.txt.
An info finding: it costs no points, because it reports what real Chrome users experienced over the last 28 days rather than what the lab measured. That is exactly the number a quarterly review wants. Sites with too little Chrome traffic have no field data, and the finding does not appear.
The link check covers the page you test (up to 100 links on your own host and 50 to other sites), not the whole site, which is why the review runs it on a fixed set of key pages.
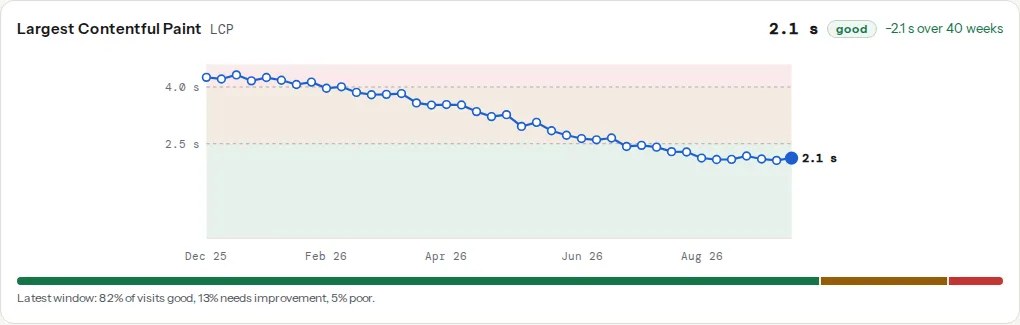
For the trend itself, the Core Web Vitals history tool plots up to 40 weekly points of the same field data against Google's thresholds, so a quarter is the last 13 points of a line you can read at a glance:
Step by step
1. Fix the page list once
Pick 10 pages and keep them for a year: the home page, the top five organic landing pages from Search Console, one page per important template (a product, a category, an article, a location page) and the page that converts best. Write the list at the top of the template. Comparing different pages from one quarter to the next produces numbers that mean nothing.
2. Gather the inputs (about an hour)
Search Console (20 minutes)
- Performance → Search results: set the date to "Compare last 3 months to previous period", then export clicks, impressions, CTR and position by page and by query. Do it once more against the same quarter last year for seasonality.
- Indexing → Pages: the indexed and not indexed counts, and the "Why pages aren't indexed" table with each reason's count. Note the rows that grew.
- Core Web Vitals: poor and needs-improvement URL counts for mobile and desktop.
- Sitemaps: status and the number of discovered pages.
What Search Console shows that a report cannot, and the reverse, is covered in Search Console vs getReport.
getReport (25 minutes)
- A report on each of the 10 pages, mobile, saved next to last quarter's link. Five fresh runs per hour are allowed per site, so run them in two sittings or spread them across the week.
- The Core Web Vitals history for the origin, phone form factor. Read the last 13 weekly points for LCP, INP and CLS.
- The sitemap validator on the site: it checks the file against the protocol and status-checks up to 25 listed URLs.
- The broken link checker on the top five pages, if their reports show broken links.
Analytics (10 minutes): organic landing pages with sessions and conversions for the quarter against the last. Search Console says who arrived; analytics says whether they did anything.
Server logs (optional, 10 minutes): if you can download a month of access logs, run them through the log analyser once. It reads the file in your browser and shows how much of Googlebot's crawl went to redirects, 404s and parameter URLs. Once a quarter is enough.
3. Fill in the template
Copy this into a Markdown file or a shared document. Keep it to two pages; the report links are the appendix.
# SEO review – Q3 2026 – example.com
Reviewer: … | Period: 1 Jul – 30 Sep 2026 | Previous review: <link>

## Summary (three sentences)
Organic clicks +8 % on Q2 and +3 % year on year; the gain is the category pages.
Product pages passed LCP in the field for the first time (2.1 s, was 3.4 s).
Indexation is the risk: "Crawled, currently not indexed" doubled to 410 pages.

## Scorecard (mobile)
| Page            | Report Q2 | Report Q3 | Overall | SEO     | Speed   | Indexable | Field LCP | Field INP | Field CLS |
|-----------------|-----------|-----------|---------|---------|---------|-----------|-----------|-----------|-----------|
| /               | <link>    | <link>    | 78 → 84 | 90 → 92 | 61 → 70 | yes       | 2.4 → 2.1 | 180 → 170 | 0.05      |
| /shoes/         | <link>    | <link>    | 71 → 80 | 82 → 88 | 55 → 68 | yes       | origin    | origin    | origin    |
| …               |           |           |         |         |         |           |           |           |           |

## Indexation (Search Console → Pages)
| Status / reason                          | Q2    | Q3    | Delta |
|------------------------------------------|-------|-------|-------|
| Indexed                                  | 1,920 | 2,010 | +90   |
| Crawled – currently not indexed          | 205   | 410   | +205  |
| Excluded by 'noindex' tag                | 340   | 338   | −2    |
| Not found (404)                          | 48    | 61    | +13   |
| Page with redirect                       | 120   | 118   | −2    |

## Technical debt carried over
| Item                               | Since | Status       | Owner     |
|------------------------------------|-------|--------------|-----------|
| CSP not set                        | Q1    | planned      | host      |
| 12 plain ?p= links in footer       | Q2    | done in Q3   | content   |

## Wins and regressions (with the cause)
- Win: product LCP into "good" after hero images moved to WebP (shipped 14 Aug).
- Regression: /blog/ INP 260 ms after the new comments widget (added 2 Sep).

## Next quarter: three projects
| Project                          | Owner     | Effort | Expected effect                         |
|----------------------------------|-----------|--------|-----------------------------------------|
| Consolidate thin tag pages       | content   | M      | Fewer "crawled, not indexed"            |
| Replace comments widget          | developer | S      | Blog INP under 200 ms                   |
| Category page CLS from banners   | developer | M      | CLS under 0.1 on /shoes/ and siblings   |

## Risks
- Certificate renews on 12 Nov; auto-renewal last succeeded on 13 Aug.
- Two plugins not updated in over two years (report: WordPress Doctor).
- staging.example.com answers publicly without a password.

## Decisions needed
1. Approve removing the comments widget or paying for the lighter plan.
2. Agree which tag pages may be merged or set to noindex.
"origin" in a field column means the page has no page-level data and the value is the whole site's; write it once rather than copying the same number into every row.
4. Read the trends honestly
Before you write a cause next to a win or a regression, rule out the four usual suspects:
- Seasonality. Compare against the same quarter last year, not only the previous quarter. A garden shop's Q3 always beats its Q1.
- A Google update. Check Google's list of ranking updates for the quarter. A step change in impressions across the whole site in the week a core update rolled out is the update, not your title rewrite.
- A redesign or migration. A new template changes everything at once; compare before and after with the method in measuring before and after a redesign.
- A tracking change. A new consent banner, a tag manager rebuild or a GA4 filter can move sessions and conversions by double digits without a single visitor changing behaviour. Search Console clicks do not depend on your tracking; if they are flat and analytics fell, suspect the tag.
Even after that, say "coincided with" rather than "caused" for any single fix. Search traffic has too many inputs to credit one change from one quarter's data.
5. Choose three projects
Take candidates from the reports' Top fixes, the indexation table and the regressions. Score each by impact and effort, pick three, and give each an owner, an effort label and the number you expect to move. The method for weighing them is in picking which fixes to do first. Three is the limit because a fourth project is the one that does not happen; the rest go into the debt table with a date.
6. Hold a 30-minute meeting
Send the document a day before. In the meeting, spend five minutes on the summary, ten on wins and regressions, ten on the three projects and five on the decisions. The report links are the appendix, opened only when someone asks "how do we know". The meeting ends when each decision has an answer or a named person who will give one by a date.
7. Archive it
- The review itself in the repository (
docs/seo-reviews/2026-q3.md) or the shared drive, next to last quarter's. - The 10 report links in the scorecard. They stay live for 12 months, so for a year-on-year comparison, also keep the PDF of each report (the PDF button in the report header) in the client or project folder.
- The Search Console exports as CSV, named by quarter.
There is no scheduled run or public API yet: the keyed API is announced for a later milestone. Until then, keep a plain checklist with the exact URLs (the 10 pages, the origin for the history tool, the sitemap address) at the top of the template, so gathering is copy, paste and wait.
Platform notes
WordPress
Add the WordPress Doctor panel to the risks section: plugins not updated in over two years, plugins closed on wordpress.org, a public staging copy and an outdated core version all show there. A plugin that changed SEO settings in an update (a new sitemap, a changed title template) is a common cause of a regression, so note plugin updates in the quarter.
Shopify, Wix and Squarespace
The platform owns HTTPS, compression and most headers, so the scorecard's Security column rarely moves. Spend the time on the indexation table and on apps: every app added in the quarter is a candidate cause of a speed regression.
Sites without field data
If the site is not in the Chrome UX Report, the field columns stay empty and the history tool shows no data. Use the lab Speed score from the reports, and read it as a range: lab scores move a few points between runs, so only a change of about 10 points is a signal.
Verify
- Every page in the scorecard has two report links, same device, same URL as last quarter.
- The indexation table has numbers for both quarters and a delta for each reason.
- Each win and regression has a date and a candidate cause checked against the four suspects.
- The three projects each have an owner, an effort and an expected number; the decisions list is empty or assigned.
- Next quarter's reviewer can find this document from last quarter's.
Common mistakes
- Comparing different pages. This quarter's top landing page against last quarter's gives a delta of two different things. Fix the list and keep it; add pages, never swap them silently.
- Judging by the Lighthouse score alone. A lab score on one run is a snapshot. Field data, indexation and clicks carry the direction; the score is one column of the scorecard, not the headline.
- A review with no decisions. A document that only reports is read once. End with three projects and the decisions needed, or the next review will list the same debt.
- Skipping the indexation table. Pages silently dropping out of the index is the slowest and most expensive trend, and it never shows in a speed score.
- A 40-page review nobody reads. Two pages and links. If a section does not lead to a decision, it goes in the appendix.