A getReport report answers more than 150 questions about one page in under a minute. That is useful and a little overwhelming: seven scores, a list of fixes, dozens of findings. This guide walks through the report from top to bottom, explains how the numbers are calculated, and ends with the order in which to fix things. Reading it properly takes ten minutes the first time and two minutes after that.
Quick answer
- Header: the exact URL tested, the device (mobile by default), when it ran. A report is reused for 12 hours; "Re-run" forces a new one.
- Overall score: a weighted average of seven module scores. Speed counts 30 %, SEO 25 %, Security 15 %, Accessibility and Best practices 10 % each, Structured data and Social 5 % each.
- Top fixes: the five findings that cost the most points. Start here.
- Each finding: what is wrong, why it matters, how to fix it, the evidence behind a toggle, and a link to the learn page.
- Fix in this order: security failures, speed failures, anything that stops the page being indexed, then the rest.
- Keep the link: it works for 12 months, so it doubles as the "before" in a before/after.
Why reading it in the right order matters
Most people read a report like a school report: they look at the grade, feel good or bad, and close the tab. The grade is the least useful part. A C made of one slow hero image and a missing redirect is an afternoon; a C made of 30 small warnings is a month. The same number, two very different weeks.
The report is built to be read in the other direction: from the specific finding up to the score. Top fixes already does the sorting for you, and every finding carries its own fix. If you read in that order, the first hour of work goes to the changes that move the most points, and you avoid the classic trap of polishing Social previews while the page loads in eight seconds.
How getReport checks it
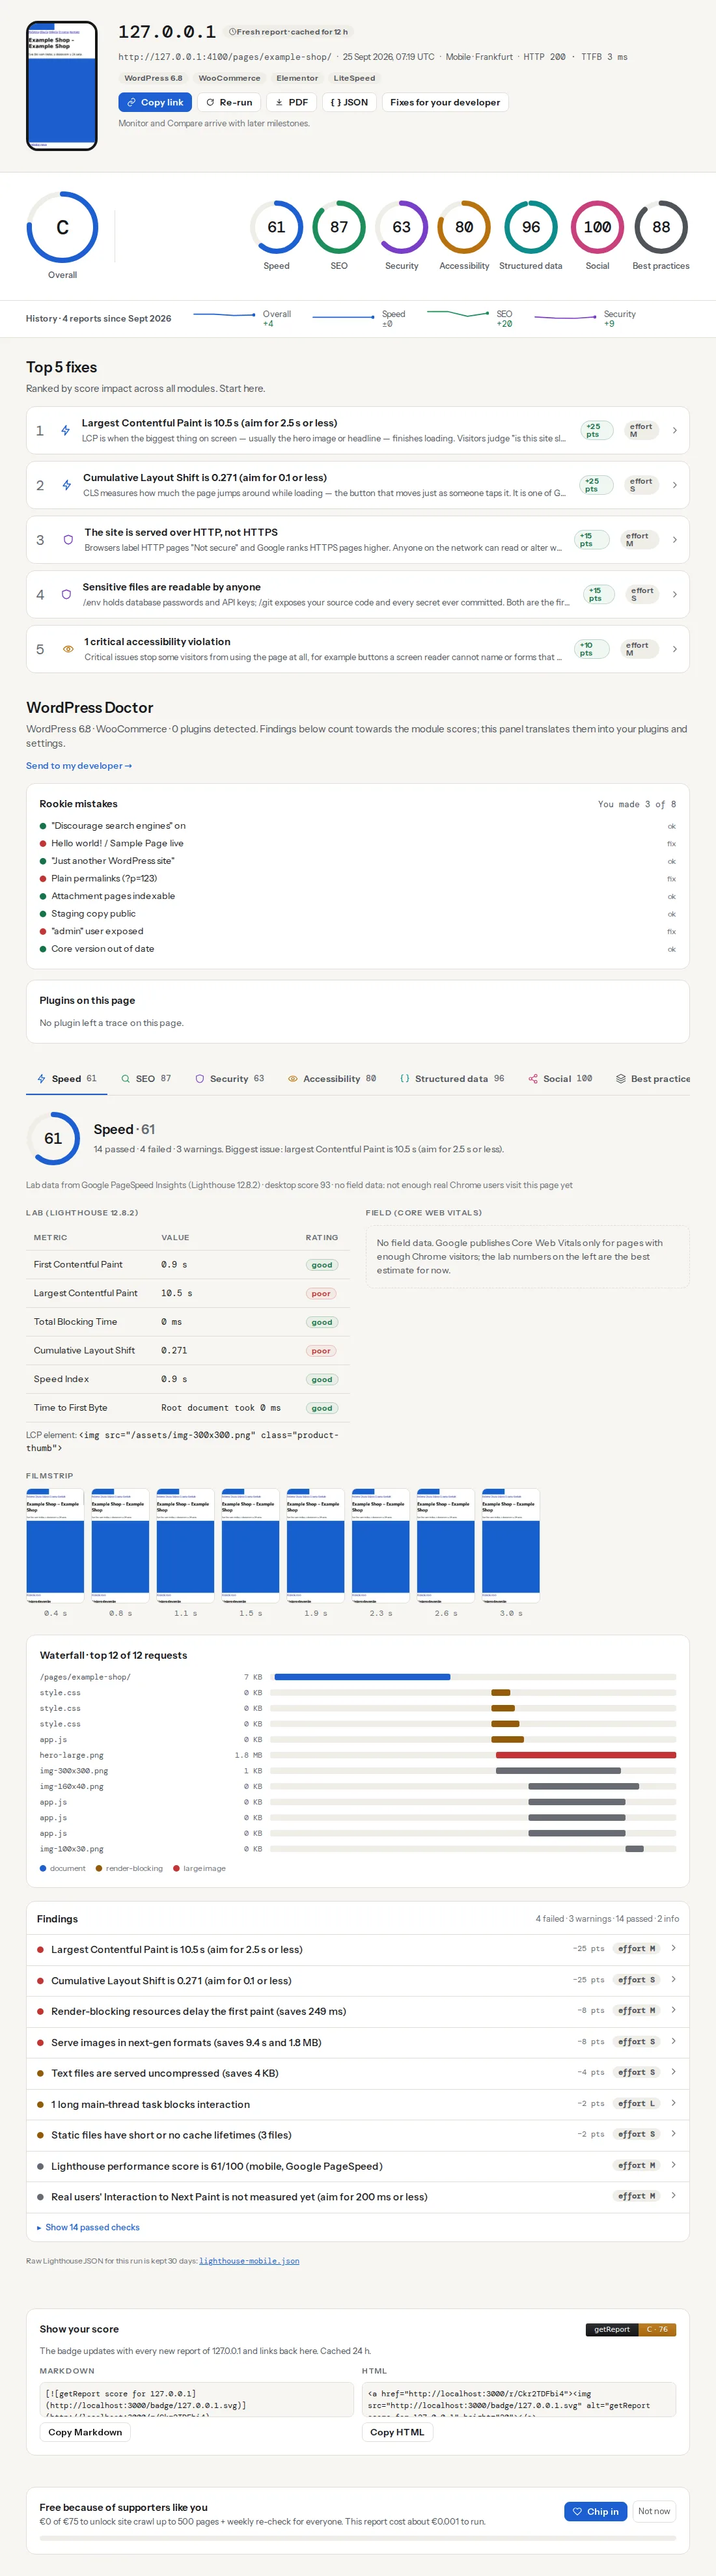
Every tool page runs the same full report and opens it at the relevant module, so a report started from the speed test or the SEO audit has all seven modules. Here is a complete one for a small shop:
The header
The first line is the domain, then the final URL (after any redirects), the time the check ran (in UTC), the device and the test location. If the page answered, you also see its HTTP status and time to first byte, and chips for the technology we recognised (CMS, CDN, analytics).
The chip beside the domain says how fresh the report is. The same URL checked on the same device within 12 hours gets the stored report instantly instead of a new run; the chip then reads "Report from 2 h ago". That keeps the service free and stops the numbers jumping around while you read. After you change something on the site, press Re-run to get a new measurement. Fresh runs are limited to 10 per 10 minutes per visitor; cached reports always open.
The score row
The big ring on the left is the overall score with its grade: A from 90, B from 80, C from 70, D from 50, F below. Next to it are the seven module rings, each from 0 to 100 and coloured like Lighthouse: green from 90, amber from 50, red below. Click a ring to jump to its module.
A module score starts at 100. Every failed check subtracts its weight, every warning half its weight; info and passed checks subtract nothing. So a failed "The page has no <title>" (weight 10) takes SEO from 100 to 90 on its own. Speed is the one exception: its score is the Lighthouse performance score, taken as is.
The overall score is the weighted average of the modules that ran:
| Module | Weight in the overall score | The question it answers |
|---|---|---|
| Speed | 30 % | How fast does the page load for a visitor on a phone? |
| SEO | 25 % | Can search engines find, read and index this page? |
| Security | 15 % | Is the connection encrypted and are the basic protections on? |
| Accessibility | 10 % | Can people using a keyboard, screen reader or zoom use it? |
| Best practices | 10 % | Is the page technically tidy: valid HTML, no console errors, compression, caching, one host? |
| Structured data | 5 % | Does the page describe itself in a form search engines can use for rich results? |
| Social | 5 % | What does a shared link look like on Facebook, LinkedIn, X and Slack? |
The weighting explains why the same finding moves the grade by different amounts. Ten SEO points are worth 2.5 overall points; ten Social points are worth half a point. If a module could not run, it is left out and the others are reweighted, so a partial report still gets a fair grade.
The findings you will meet first
Four findings show up on almost every report and illustrate the range:
The first is information only: it costs no points itself, because it is the Speed score. LCP carries 25 points, the same share Lighthouse gives it, which is why a slow hero image so often sits at the top of Top fixes. HTTPS is a 15-point failure in Security. A missing title is a 10-point failure in SEO that takes a minute to fix.
Step by step
1. Check you tested the right page
Before reading anything else, look at the final URL in the header. If you typed example.com and the final URL is https://www.example.com/en/, the report describes that page, and the redirect on the way is itself a finding. Also check the device: mobile scores are nearly always lower than desktop because Lighthouse simulates a mid-range phone on a slow connection. Compare mobile with mobile.
2. Read Top fixes before the scores
Top fixes lists the five open findings that remove the most points, fails before warnings when two cost the same. Each row shows the title, the first line of "why", the points it would give back to its module, and the effort: S, M or L. Click a row to jump to the full finding inside its module.
The points are module points. "+10 pts" on a missing title means 10 points of SEO, which is 2.5 overall. Speed points mirror Lighthouse's own metric weights (Total Blocking Time 30, LCP and CLS 25 each), so they estimate what a metric can give back; the Speed score itself always comes straight from Lighthouse. Effort is not part of the ranking, so read the two chips together: a "+10 pts, effort S" item is usually a better first job than "+12 pts, effort L".
3. Open a finding and read it in order
Inside each module, findings are grouped: failed first, then warnings, then a collapsed list of passed checks. A finding opens to five parts:
- Title: what is wrong, with the real value filled in ("Largest Contentful Paint is 4.1 s").
- Why it matters: two lines for a non-developer.
- How to fix: numbered steps, including where the setting lives in common CMSs.
- Show technical detail: the evidence (the header we received, the element, the list of affected files). This is what a developer needs to reproduce it.
- Learn more: the learn page for that check, and from there the in-depth guide.
A "Was this useful?" vote sits at the bottom; it tells us which copy to improve.
4. Read Speed with lab and field side by side
The Speed module shows two kinds of numbers. Lab numbers come from one Lighthouse run through Google PageSpeed Insights: repeatable, detailed, and the basis for the Speed score. Field numbers come from the Chrome UX Report: the 75th percentile of real Chrome visitors over 28 days, for this page or, when the page has too few visitors, for the whole site. Small sites often have no field data at all; the module says so.
When they disagree, the field numbers are what visitors experience and what Google uses for Core Web Vitals; the lab numbers tell you why. The full walkthrough of the filmstrip and the request waterfall is in how to read a website speed test.
5. Fix in the right order
A triage order that works on almost every site:
- Security failures. No HTTPS,
http://not redirecting, an expired certificate, exposed files. They affect every visitor, browsers warn about some of them, and most are an hour of work. - Speed failures. LCP, CLS and INP in red. They cost visitors on every page view and they are a ranking signal.
- Anything that stops indexing. A
noindex, a robots.txt block, a canonical pointing elsewhere. If the page cannot be indexed, nothing else in SEO matters, so if you see one of these, move it to the front. - The rest, by points and effort. Warnings, Structured data, Social, Best practices. Pick the small-effort items first and batch them.
The one-page SEO audit guide goes through the SEO module in the same spirit.
6. Share, export and keep the link
The report link is permanent for 12 months. It is not indexed by search engines, and when you paste it into Slack, email or LinkedIn, the preview shows the grade and the module scores. The buttons in the header:
- Copy link: the report URL.
- PDF: the whole report with every finding expanded, for a client or a meeting.
- JSON: every score and finding in machine-readable form, the same data the page is built from.
For the person who will do the work, the fixes view at the report address plus /fixes lists only the open findings, grouped by effort, with Markdown and CSV exports. How to hand that over is covered in send the fixes to your developer.
At the bottom of the report, "Show your score" gives a badge in Markdown and HTML. It links back to the latest report and updates with each new one.
7. Re-run and read the history strip
After the fixes are live, press Re-run. When the domain has earlier reports, a history strip appears under the score row with a small trend line and the change since the previous report for Overall, Speed, SEO and Security. That strip and the two report links are your before/after evidence.
Platform notes
WordPress
When the page is a WordPress site, a WordPress Doctor panel appears right after Top fixes. It maps findings to the plugins, theme and settings the page reveals, and lists the classic launch mistakes. It is a view, not an eighth score: its findings count towards SEO, Security, Speed and Best practices like any other. It also links to the fixes view as "Send to my developer".
Any other platform
Shopify, Wix, Squarespace and hosted builders do not let you change some things (server headers, redirects at the server). The finding still applies; the fix is either a platform setting or not in your hands. Note those, fix the rest, and do not chase a score the platform caps.
Verify
- The header shows the page and device you meant to test.
- After your changes, a re-run no longer lists the fixed items in Top fixes, and the module rings moved by roughly the points shown.
- The history strip shows a positive change for the modules you worked on.
Common mistakes
- Comparing a mobile report with a desktop one. The desktop run always looks better. Re-run on the same device before comparing.
- Re-checking within 12 hours and seeing no change. You got the cached report. Use Re-run.
- Reading one Lighthouse run as the truth. The lab score moves by a few points between runs because of network and server variance. Look for changes of 5 points or more, and at the field data when there is some.
- Treating the score as a ranking prediction. Google does not use this score. The checks cover things that affect rankings and visitors, but a 95 does not mean page one, and a 70 does not mean page ten.
- Starting with the cheapest module. Structured data and Social together are 10 % of the grade. Fix Security and Speed failures first; they touch every visitor.