A page can score 100 in Lighthouse and still fail Core Web Vitals for real visitors. Another page scores 60 and passes all three. Both results are correct, because they measure different things: one is a single simulated visit in a lab, the other is what thousands of real visits looked like over four weeks. This guide explains what each number is, why they disagree, which one Google uses, and how to read them together so you work on the right thing.
Quick answer
- The Lighthouse performance score is a weighted blend of five lab metrics from one simulated page load on a throttled phone. It is a diagnostic, not a ranking factor.
- Core Web Vitals (LCP, INP, CLS) come from real Chrome users, at the 75th percentile over 28 days. That field data is what Google's ranking systems use.
- When you have field data, it decides what to fix. The lab run tells you why and names the file.
- INP has no lab version. Total Blocking Time is the closest proxy, and a good TBT does not guarantee a good INP.
- Past about 90, extra Lighthouse points cost a lot and rarely change what visitors feel.
- The speed test shows the score, the lab metrics and the field data side by side.
Why the difference matters
Teams that optimise the wrong number lose weeks. A score of 100 is easy to celebrate and easy to show a client, so it becomes the goal. Meanwhile the checkout still freezes for half a second after every tap on a mid-range phone, which the score cannot see. The reverse happens too: a site with happy, fast real visitors gets rebuilt because a lab test said 58.
What the Lighthouse score is
Lighthouse loads the page once, on simulated hardware, and measures five metrics. Since Lighthouse 10, the score weights them like this:
| Metric | Weight |
|---|---|
| Total Blocking Time (TBT) | 30% |
| Largest Contentful Paint (LCP) | 25% |
| Cumulative Layout Shift (CLS) | 25% |
| First Contentful Paint (FCP) | 10% |
| Speed Index (SI) | 10% |
Each metric is turned into a 0–100 score on a log-normal curve built from real-world site data, then the weighted scores are added up. The weights have changed between versions (Lighthouse 10 dropped Time to Interactive and gave its share to CLS), so scores from different versions are not comparable.
The mobile run simulates a mid-range phone on a slow 4G connection with a CPU four times slower than the test machine. It is one visit, with an empty cache, no consent choice, no logged-in state and no interaction. Run it twice and the score moves by a few points.
What Core Web Vitals are
Core Web Vitals come from the Chrome UX Report (CrUX): anonymous measurements from Chrome users who opted in, collected on real devices and networks. Each metric is reported at the 75th percentile over a rolling 28 days, so three out of four visits were at least that good. The thresholds, from web.dev's Core Web Vitals page:
| Metric | Good | Poor |
|---|---|---|
| Largest Contentful Paint | ≤ 2.5 s | > 4 s |
| Interaction to Next Paint | ≤ 200 ms | > 500 ms |
| Cumulative Layout Shift | ≤ 0.1 | > 0.25 |
INP measures how quickly the page responds to taps, clicks and key presses during the whole visit. A lab run does not tap anything, so INP cannot be measured there at all.
Which one Google uses
Google's Search documentation on Core Web Vitals says its ranking systems use Core Web Vitals, and Search Console's Core Web Vitals report is built from the same field data. The Lighthouse score is not part of that. A perfect score does not help rankings on its own; good field data does, as one signal among many.
How getReport checks it
The speed test asks Google PageSpeed Insights for a mobile and a desktop Lighthouse run and shows them next to the field data PSI returns from CrUX. The Speed module's score ring is the Lighthouse score for the report's device, mobile by default; the other device's score is in the line above the tables.
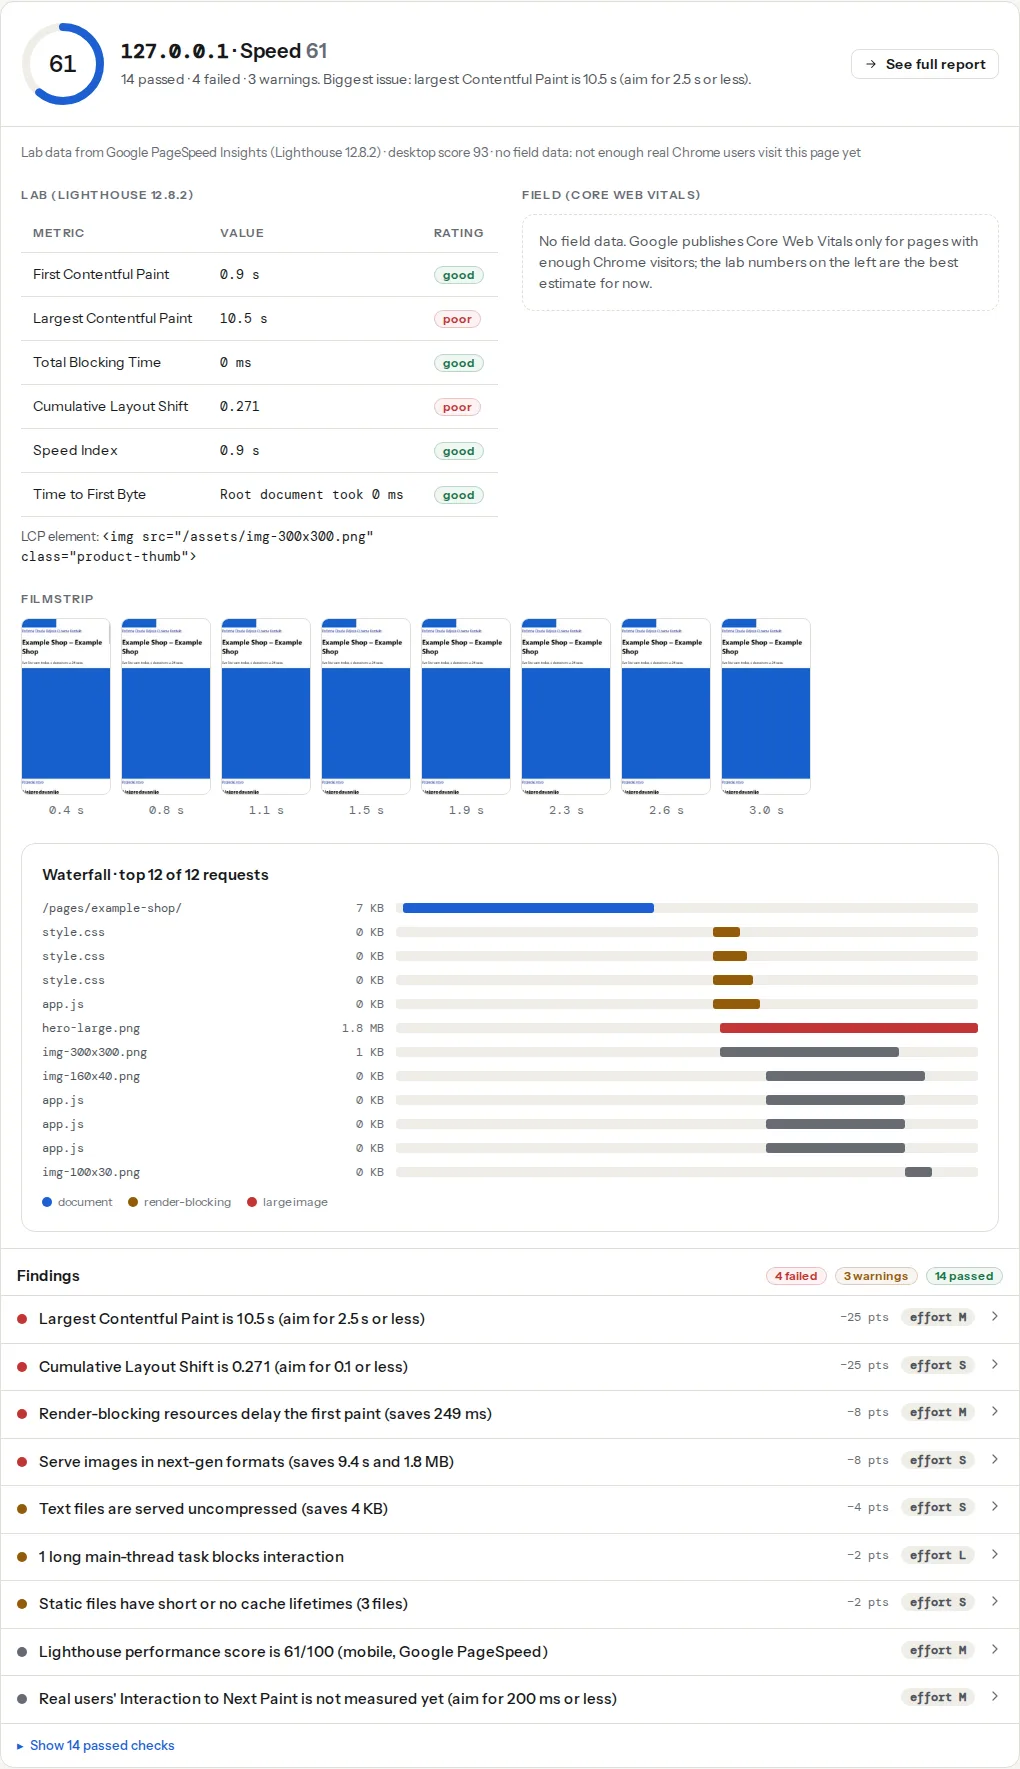
The lab table lists six numbers; five of them feed the score, and Time to First Byte is there for diagnosis. The Lighthouse version is printed next to the table.
The field column shows each Core Web Vital as a bar with its 75th percentile and the share of good, needs-improvement and poor visits. The header line says whether the data is for "this page" or the "whole site": when a page has too few visits of its own, getReport falls back to the origin's data. When neither exists, the column says so, and the lab numbers are the best estimate.
INP is never scored in the lab. Without field data the INP finding reads "not measured yet" and costs no points. If Google's measurement is unavailable (quota or an outage), the report can fall back to a local Lighthouse run and labels the result "lab estimate" rather than "Google PageSpeed".
Step by step
1. Start with the field column
Look at the field column before the score. Three cases:
- Page-level data. The best case: these are your real visitors on this URL. Any metric in "poor" or "needs improvement" is your priority, whatever the score says.
- Whole-site data. The numbers describe the whole domain, weighted by traffic. They tell you whether the site has a problem; they do not prove this page has it.
- No field data. Common for small sites and new pages. Work from the lab run, and use the lab vs field guide to understand what the lab can and cannot predict.
2. Read the two together
Three situations that come up again and again:
Score 95, field INP poor. The page loads fast in the lab, then real visitors interact with it while a chat widget, a consent script and a tag manager are still running, or every tap triggers heavy JavaScript. Lighthouse stopped measuring when the load was quiet. Look at TBT and the long-tasks finding for hints, then at which scripts run on interaction: delayed scripts that all start on the first tap are a classic cause.
Score 60, field data good. Real visitors are mostly on desktop or fast phones, many come back with a warm cache, or the heavy part of the page is below the fold. The lab's slow phone on slow 4G is harsher than your audience. Fix what the lab names if it is cheap, but the site is not failing its visitors.
Score 61, no field data (the screenshot above). TBT is 0 ms, so the main thread is fine. The points are lost to LCP (10.5 s) and CLS (0.271). The waterfall shows why: a 1.8 MB image takes most of the bandwidth on the simulated connection, and the image-formats finding estimates 9.4 s of savings. Compress and resize it, give images their width and height, and both metrics move. This is where the lab earns its keep: it names the file.
3. Use the lab to find the cause
Field data says what is slow for visitors; it never says why. Once you know which metric to work on, the lab findings under it name the LCP element, the render-blocking files, the long tasks and the third-party scripts. Reading a website speed test walks through the filmstrip and the waterfall.
4. Treat TBT as an INP hint, not a promise
Total Blocking Time adds up how long the main thread was blocked during the load. A page with 2 s of TBT will almost certainly have slow interactions too. A page with 0 ms of TBT can still have poor INP if the work happens on interaction (a filter that re-renders 500 products) or after the load (scripts that start late). Only field data confirms INP.
5. Measure changes properly
- Compare runs from the same Lighthouse version (it is printed in the panel) and the same device.
- Run the test several times and look at the spread, not one number. getReport caches a report for 12 hours per URL, so use the report's Re-run button for a fresh measurement.
- Expect field data to move slowly: it is a 28-day window, so a fix shows fully about four weeks later. The Core Web Vitals history tool shows the weekly trend for up to 40 weeks.
6. Decide when to stop
The score curves flatten at the top. Taking LCP from 4 s to 3 s earns many points; taking it from 1.8 s to 1.3 s earns few, and visitors barely notice. The last points often come from removing things people want: the product video, the reviews widget, the live chat. Once field data is green and the lab score is in the 90s on mobile, spend the time on content or conversion instead. Mobile and desktop differ for good reasons; mobile vs desktop scores explains why mobile is always lower.
Tip
When a client asks why the score is not 100, show the field column first. "Three out of four real visits load the main content in under 2.5 seconds" is a sentence a client can act on; a lab score is not.
Platform notes
WordPress
Optimisation plugins with "delay JavaScript until interaction" can lift the lab score dramatically, because Lighthouse never interacts and the scripts never run. Real visitors do interact, and on the first tap every delayed script starts at once, which can make INP worse. After enabling such a setting, keep checking field INP over the following four weeks, and exclude scripts that the first interaction needs (menus, add to cart, search).
Verify
- You can say which Core Web Vital is the page's weakest, from field data if the page has it.
- The fix you made moved that metric in the lab run, from the same Lighthouse version and device.
- Four weeks later, the field column shows the metric at or below the "good" threshold, for the page or the whole site.
Common mistakes
- Optimising for the score. Symptom: a 100 in the lab and complaints about a slow checkout. Fix: start from field data and the metric that fails.
- Comparing scores across Lighthouse versions. A version change can move the score with no change to the site. Check the version in the panel before comparing.
- Judging from one run. Scores vary by several points run to run. Look at several runs and at the metrics, not the total.
- Quoting the desktop score in a mobile world. Most sites get most visits from phones, and Google indexes the mobile version. Report the mobile number.
- Celebrating the score while INP fails. The lab cannot see interactions. If field INP is poor, the page is slow where it matters most, whatever the score says.