"Reduce initial server response time" is the finding people on shared hosting see most and can do least about, or so it seems. The plan is cheap, the server is shared with hundreds of other sites, and the host's answer is an upgrade. In practice most of a slow first byte on shared hosting is not the hardware: it is PHP rendering the same page from scratch for every visitor, a plugin making a slow query or calling home, and a PHP version two years out of date. Each of those has a fix in the hosting panel or the CMS admin that costs nothing. This guide lists them in the order that pays off, shows how to measure properly, and says when the plan really is the problem.
Quick answer
- Page caching. The host's cache, LiteSpeed Cache, WP Super Cache or WP Rocket. Turns a 1.2 s uncached response into 100–200 ms. Do this first; it makes everything else matter less.
- PHP 8.2 or newer with OPcache on, from the hosting panel. Typically 20–40 % less PHP time than 7.4.
- Find the slow plugin with Query Monitor and remove or replace it.
- Stop outbound HTTP calls during page loads (licence checks, feeds, update checks) and move
wp-cronto a real cron. - Object cache if the host offers Redis or Memcached; a CDN in front; a fast DNS provider.
- Move hosts only when cached pages are still over 600 ms consistently.
Measure before and after with the TTFB test, three runs each.
Why server response time matters
Time to First Byte is the wait before the browser receives anything. It is made of the DNS lookup, the TCP and TLS handshakes, any redirects, and then the server's own think time: the time between receiving the request and sending the first byte of the answer. On a static file the think time is a few milliseconds. On an uncached CMS page it is everything PHP does: start, load the theme and every active plugin, run 50–150 database queries, build the HTML. On a busy shared server that can be a second or two.
Nothing else can start until that byte arrives. Google's threshold for a good TTFB is 800 ms at the 75th percentile of real visits; over 1,800 ms is poor. Lighthouse's own server response time audit is stricter and flags anything over 600 ms. A page with a 1.5 s TTFB cannot have an LCP under 2.5 s no matter how small its images are, which is why this finding sits near the top of most slow reports.
Shared hosting adds two things of its own. The CPU is shared, so the same PHP work takes longer at busy times. And PHP workers are usually stopped after a few idle minutes, so the first visitor after a quiet period pays a start-up cost of several hundred milliseconds. Both make caching more valuable, not less: a cached page needs almost no CPU and no PHP at all.
How getReport checks it
The test measures the first byte from our location in Frankfurt with a fresh connection, the way a first-time visitor arrives, and records each redirect hop separately (the report header shows the time getReport measured itself). The speed module adds Lighthouse's numbers from the same PageSpeed Insights run that produces the rest of the speed findings, and the field TTFB from real Chrome users where the site has enough traffic.
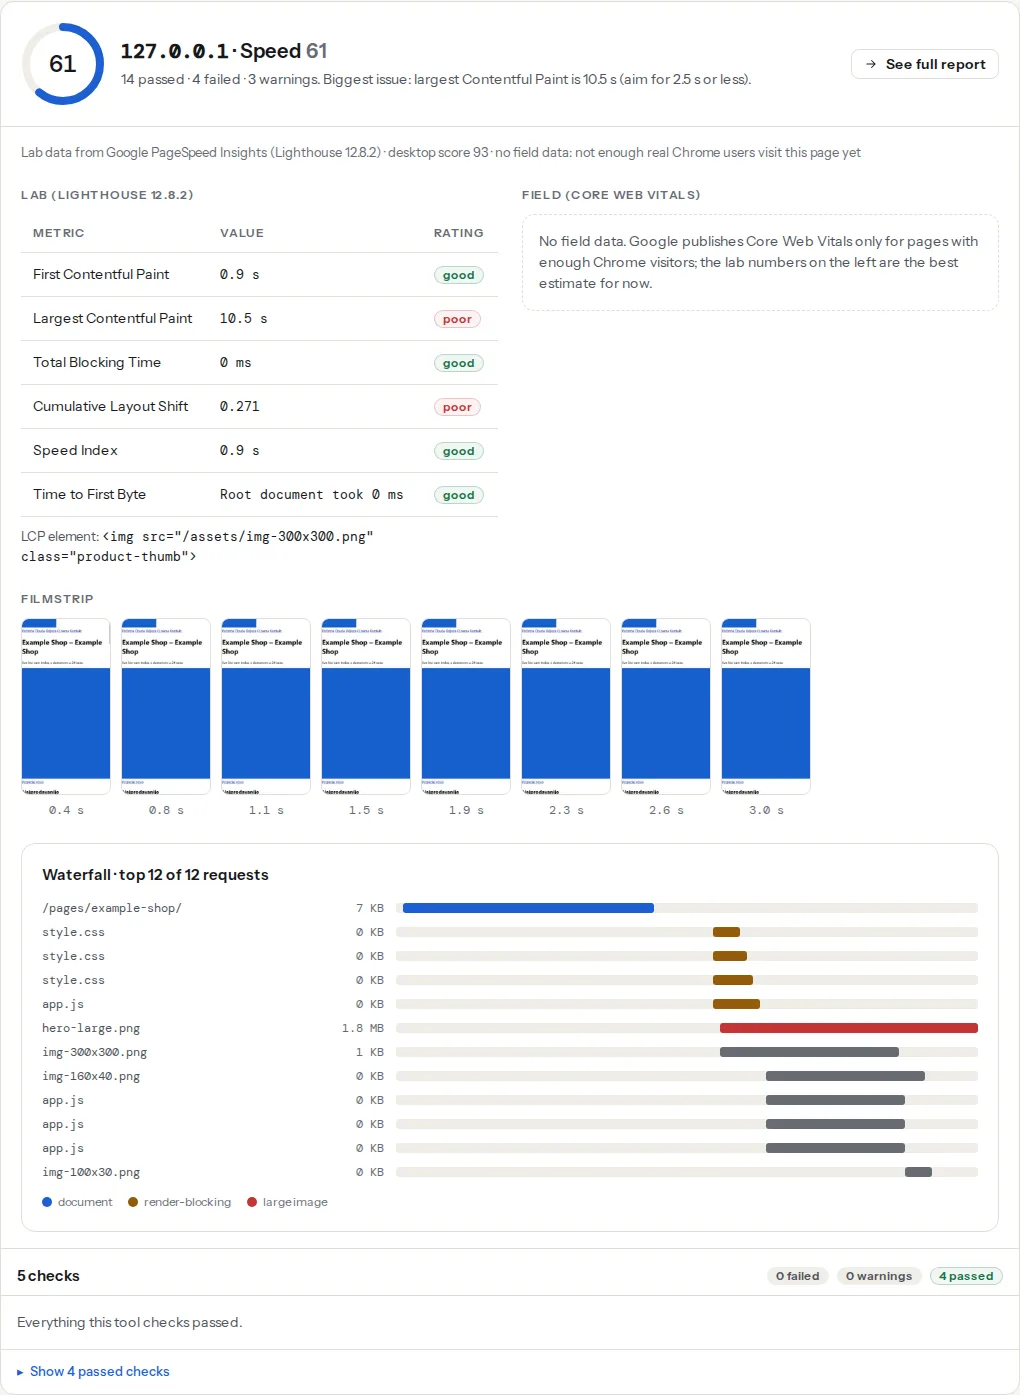
The two findings use different thresholds on purpose: ttfb is rated against Google's Core Web Vitals thresholds (800 ms and 1,800 ms), server-response-time against Lighthouse's stricter 600 ms audit. A page can pass the first and fail the second; the second is the one to aim for on cached pages.
Cache lifetimes for static files do not change TTFB for the HTML, but on shared hosting they matter for the same reason: every request for a logo or a stylesheet that a browser could have kept is a request your overloaded server has to answer.
Step by step
1. Measure properly first
One run is not a measurement on shared hosting. Run the TTFB test three times, a minute apart, and write down the three numbers. Then run curl from your own machine to split the wait into its parts:
curl -o /dev/null -s -w 'dns %{time_namelookup}s  connect %{time_connect}s  tls %{time_appconnect}s  ttfb %{time_starttransfer}s  total %{time_total}s\n' \
  https://example-shop.hr/
Read it as a chain: dns is the lookup, connect includes the TCP handshake, tls includes the TLS handshake, ttfb is when the first byte arrived. The server's think time is roughly ttfb minus tls. If that is 50 ms and the total is still 900 ms, the time is in DNS, distance or a redirect, not in PHP; skip to steps 7 and 8. If it is 800 ms, continue with step 2.
Three patterns and what they mean:
- Consistently slow (1,200 / 1,150 / 1,300 ms): PHP does this much work every time; there is no page cache, or it is not working.
- First slow, then fast (1,800 / 220 / 240 ms): the cache was cold or the PHP workers had to start. Longer cache lifetimes and a warm-up (step 2) fix most of it.
- Random (300 / 1,400 / 500 ms): the server is overloaded by other tenants or by your own cron jobs. Steps 2 and 5, then step 9.
2. Turn on page caching
A page cache stores the finished HTML the first time a page is built and serves that copy to the next visitors without starting PHP. It is the fix that turns a 1.2 s think time into a few milliseconds. In order of preference:
- The host's own cache, if there is one: LiteSpeed Cache on a LiteSpeed server (look for "LiteSpeed" in the hosting panel or the
serverresponse header), SiteGround Optimizer, Hostinger's cache. These run at the web server level, before PHP, which is the fastest kind. - WP Super Cache (free) or WP Rocket (paid) on Apache and nginx hosts. WP Super Cache's "Expert" mode uses
.htaccessrules to serve the cached file without PHP; the "Simple" mode still starts PHP but skips most of the work.
Settings that matter, whichever you use: cache lifetime of 12–24 hours rather than the default hour, so pages stay warm; purge on post update, not on every comment; preload or "warm-up" if offered, so the first visitor does not pay. Exclude the cart, checkout and account pages; every plugin knows the WooCommerce ones by default.
The result to expect: cached pages between 100 and 300 ms from Frankfurt on a European host. If they are still over 600 ms, the cache is not being hit (test in a private window; logged-in visitors bypass it) or the time is not in PHP at all (step 1).
3. Update PHP and check OPcache
Each PHP major version is faster than the last; going from 7.4 to 8.2 or 8.3 saves 20–40 % of PHP time on a typical WordPress site with no other change. In cPanel it is "Select PHP Version" or "MultiPHP Manager"; in Plesk, "PHP Settings"; other panels have an equivalent. WordPress → Tools → Site Health → Info → Server shows what you are running now. Switch back if the site shows errors; it is one dropdown either way.
In the same panel, make sure OPcache is enabled (it keeps compiled PHP in memory; without it every request recompiles every file). Site Health → Info → Server reports "opcache enabled". It is on by default on nearly every host; if it is not, it is a checkbox or an entry in the PHP extensions list.
4. Find the slow plugin
An uncached page that takes 1.5 s usually has one plugin responsible for most of it. Install Query Monitor, open any page while logged in, and look at the admin-bar timing: the "Queries by Component" panel lists database time per plugin, and the "HTTP API Calls" panel lists outbound requests made during the page load. Look for one plugin with hundreds of queries, a single query over 100 ms, or any HTTP call at all.
The usual suspects: statistics and "visitor log" plugins writing a row per visit into a table with millions of rows; related-posts plugins scanning the whole post table; security plugins checking every request against a large list; broken-link checkers running on the front end; and page builders loading their whole framework on every page. Remove what you do not use, replace what you do with a lighter equivalent, and re-measure. Which WordPress plugin is slowing your site has the full method.
Deactivate Query Monitor when you are done; it has its own cost.
5. Stop outbound calls and move wp-cron
Plugins that phone home during the request (licence validation, update checks, feeds, "latest news" widgets) show in Query Monitor's HTTP API Calls panel with the seconds each took. Some wait for a 5 s timeout when the remote is down. Remove the plugin or ask its author for a setting.
The second is wp-cron. WordPress runs scheduled tasks (publishing, backups, e-mails, plugin housekeeping) by piggy-backing on visitor requests: a visitor's page load triggers the queue and, depending on the host, sometimes waits for it. Turn that off and run the queue from a real cron job every five minutes instead:
// wp-config.php, above the "That's all, stop editing" line
define('DISABLE_WP_CRON', true);# cPanel → Cron Jobs (or the host's scheduler), every 5 minutes
*/5 * * * * wget -q -O - https://example-shop.hr/wp-cron.php?doing_wp_cron >/dev/null 2>&16. Use an object cache if the host offers one
An object cache (Redis or Memcached) keeps the results of repeated database queries in memory, so uncached page views and the admin get faster. It only works when the host provides the service; look for "Redis" or "Memcached" in the hosting panel. If it is there, LiteSpeed Cache has an Object Cache tab and the Redis Object Cache plugin works with any setup. If not, skip this step.
7. Put a CDN in front
Cloudflare's free plan caches static files at the edge and terminates TLS with HTTP/2 and HTTP/3, and with a cache rule it can serve the HTML of anonymous visitors from the edge too, which takes the shared server out of the picture for most traffic. It also makes the distance part of TTFB small for visitors far from the host. See CDN basics for the setup and the bypass rules. On a page that is already served from a good page cache, the gain for nearby visitors is small; for far-away visitors and for traffic spikes it is large.
8. Check DNS and redirects
The dns value from step 1 should be under 50 ms after the first lookup. Some registrars' bundled nameservers are slow or far away; Cloudflare's, or any large DNS provider, is free and fast. And every redirect before the page is a full round trip plus, for http://, a new connection: the TTFB tool lists the hops. http://example-shop.hr should go to https://example-shop.hr/ in exactly one 301. Redirects without chains shows the rules.
9. When it really is the plan
If cached pages are still consistently over 600 ms from a nearby location after steps 2–8, or TTFB swings between 200 ms and 2 s from minute to minute, the server is overloaded and the plan is the limit. Signs it is time: the host's own status page shows high load; your curl timing shows the think time varying widely while your site does the same work every time; the host cannot tell you what the CPU limit of the plan is.
Before paying, measure the candidate: most hosts offer a trial or a staging copy. Run the TTFB test on the same three pages on both hosts and compare numbers, not the plan names. A €10 VPS or a managed WordPress plan with persistent PHP workers typically serves cached pages in under 200 ms and uncached ones in 300–500 ms.
Platform notes
WordPress: Tools → Site Health → Info lists the PHP version, OPcache, the object cache and whether a page cache was detected: a checklist for steps 2, 3 and 6. Joomla and Drupal: the built-in page cache (System → Cache in Joomla, Internal Page Cache in Drupal) does the job of step 2. Static sites: TTFB is the web server's; if it is slow, start at step 8. Shopify, Wix, Squarespace: the platform's TTFB is not yours to change.
Verify
- Three TTFB test runs of a public page in a private window agree within 100 ms and are under 300 ms.
- The
server-response-timefinding passes (under 600 ms) and thettfbfinding is rated good. - The second
curlof the same page carries the cache's header:x-litespeed-cache: hit,x-cache: HIT,cf-cache-status: HIT, or acache-controlwithmax-ageand anage:line. - Query Monitor shows no HTTP API calls on a front-end page and no single query over 100 ms.
- The field TTFB in the speed panel is under 800 ms at the 75th percentile after four weeks.
Common mistakes
- Testing while logged in. Symptom: the cache is on and every test is slow. Logged-in users bypass page caches; test in a private window.
- Two caching plugins. Symptom: pages served stale, or not cached at all. The host's cache plus one plugin at most, with one of them clearly in charge of purging.
- Blaming the theme for a hosting problem. Symptom: a beautiful lightweight theme and a 1.5 s cached TTFB. A cached page does not run the theme; the time is on the server or the network.
- Leaving wp-cron on a busy site. Symptom: random slow requests. Every few minutes a visitor gets the queue; move it to a real cron.
- Upgrading the plan first. Symptom: the same 1.2 s on the more expensive plan. Uncached PHP is slow on any shared server; cache first, then judge the plan on cached pages.