A filmstrip is the page load as the visitor saw it: a row of screenshots taken at intervals from the moment the request was sent, from blank to finished. Where the waterfall shows what the browser was doing, the filmstrip shows what the person was looking at, and it is the fastest way to understand a metric without knowing what the metric measures. This guide explains how to read the frames against FCP, LCP, Speed Index and CLS, the five stories a filmstrip usually tells, and what to change for each.
Quick answer
- The first frame that is not blank is First Contentful Paint. Aim for 1.8 s or less.
- The frame where the biggest thing appears (hero image, headline, product photo) is Largest Contentful Paint. Aim for 2.5 s or less.
- How quickly the frames fill up between those two is Speed Index. Aim for 3.4 s or less.
- Frames where things move without the visitor doing anything are layout shifts; the total is CLS. Aim for 0.1 or less.
- Blank for 2 s then everything at once: server or render-blocking files. Text early, images late: image loading. A jump when a font or banner arrives: CLS. A spinner: client-side rendering. Run the speed test; the filmstrip sits under the lab table.
Why the filmstrip matters
The metrics and the filmstrip describe the same load. Lighthouse derives Speed Index from the frames themselves (how complete each one is compared with the final one), and takes First and Largest Contentful Paint from the browser's paint timings, which the frames show at the sampling interval. Reading the frames, you can see the same things without a definition, and you can see what the numbers cannot say: that the page was "ready" in the visitor's eyes a second before LCP because the headline was there and the image was decoration, or that it was not ready a second after, because a cookie banner covered it.
Where to get one
- getReport's speed test: eight frames from the Lighthouse run, each labelled with its time in seconds, under the lab metrics. Enough to see the shape of the load.
- PageSpeed Insights: the same Lighthouse frames, shown under the metrics of the lab section.
- WebPageTest → Filmstrip view: frames every 100 ms (configurable), side by side with the waterfall, and two runs side by side for a before/after comparison. The most detailed option.
- Chrome DevTools → Performance: tick "Screenshots", record a reload, and hover the film reel at the top of the timeline. Frames at the resolution of the trace, on your own connection unless you throttle.
How getReport checks it
The speed panel shows the lab table first, and the filmstrip directly under it. Each frame is stamped with its timing, so the metrics in the table can be matched to a frame by eye:
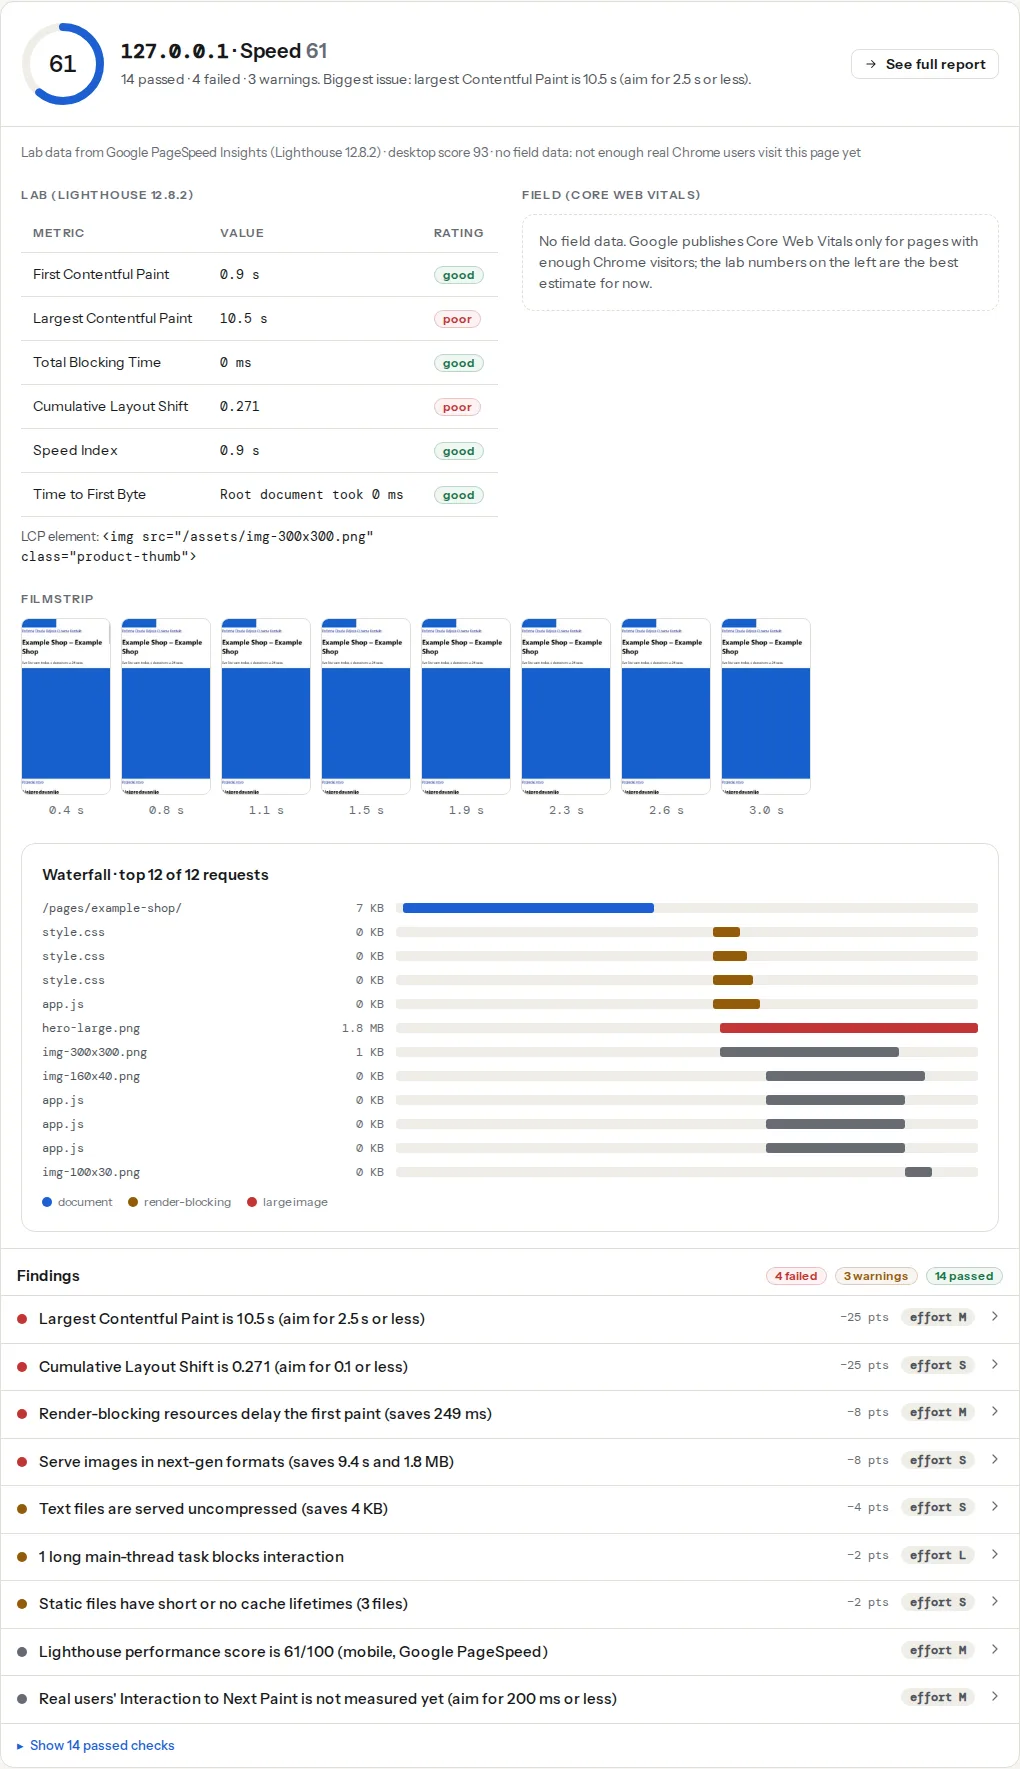
The four findings read the metrics from the same run the frames come from. The LCP finding also names the element, which is the thing to look for in the frames; the CLS finding lists the elements that moved, which is what to look for in the frames where the layout changes.
Reading the frames against the metrics
First Contentful Paint: the first non-blank frame
Find the first frame with any text or image. Its timestamp is FCP, give or take the interval between frames. Everything before it was the server (the time to first byte) plus whatever blocked rendering: stylesheets and synchronous scripts in <head>, a web font the headline waited for if the font is set to block. The Speed Index and FCP guide goes deeper into what delays it.
Largest Contentful Paint: the frame where the biggest element lands
Take the element from the LCP finding (the hero image, the H1, a product photo) and find the first frame where it is fully visible. That is LCP. If the element is text, LCP is usually close to FCP; if it is an image, the gap between the two is the image's download and decode, and the frames in between show a page with a hole where the image will go, or nothing, if the space was not reserved.
Speed Index: how fast the frames fill in
Speed Index is the average time at which the visible parts of the page were displayed. A page whose frames go from blank to 90 % complete in one step has a Speed Index near that step; a page that shows the header at 1 s, the text at 2 s, the images at 4 s and the sidebar at 5 s has a higher Speed Index than its FCP or LCP suggest, because much of the screen arrived late. Read it as "how many frames look unfinished". A low Speed Index with a high LCP means one big element is the only thing late; a high Speed Index with a fine LCP means many small things are.
Cumulative Layout Shift: the frames where things move
Compare consecutive frames after FCP. A headline that drops two lines when the web font arrives, a body that slides down when a banner is inserted above it, a grid that reflows when images without dimensions load: each is a shift, and CLS adds up the area moved times the distance. The CLS finding names the elements; the frames show you when it happened, which points at the cause (a font at 1.2 s, an ad slot at 2.8 s, a cookie banner at 3.5 s).
Tip
Frames are sampled, so a shift that happened and was undone between two frames is invisible in the filmstrip but still counted. When the CLS finding lists an element you cannot see moving, use WebPageTest at 100 ms intervals or the DevTools Performance panel, which highlights each shift on the timeline.
The five stories
1. Blank, blank, blank, then everything
Frames 0.5 s, 1.0 s, 1.5 s, 2.0 s are white; the 2.5 s frame is the finished page.
The browser had nothing to draw until everything arrived at once. Two causes, told apart by the waterfall: a slow first byte (the HTML itself arrived at 2 s) or render-blocking files (the HTML arrived at 0.4 s but stylesheets and scripts in <head> held the first paint until 2.3 s). Fix the server response first (page cache, CDN), then defer the scripts and trim the CSS. The waterfall guide shows how to tell the two apart from the first bar.
2. Text early, images late
Frame 1.0 s has the header and headline; frames 1.5 s to 3.5 s show the same page with empty spaces; the 4.0 s frame has the hero and product photos.
FCP is fine, LCP is not, and Speed Index is in between. The images are too big, discovered late (a slider, a CSS background, a lazy-load script that caught the hero), or queued behind other files. The LCP finding names the image; How to fix Largest Contentful Paint covers the size, the priority and the discovery. If the empty spaces are not even reserved (the text sits at the top and moves down when the image arrives), the same story also produces CLS.
3. A jump when the font or the banner arrives
Frame 1.0 s shows the headline in a fallback font; frame 1.5 s shows it in the brand font, one line longer, with everything below shifted down. Or: frame 2.0 s is the page; frame 2.5 s is the page with a promo bar at the top and every element 60 px lower.
This is CLS with a visible cause. For fonts: font-display: swap with a fallback sized to match (size-adjust, ascent-override), or font-display: optional so the fallback stays on slow loads, and a preload for the one file the headline uses. For banners and cookie notices: reserve their space, or overlay them (position: fixed) so they do not push content. Ads: a fixed-size slot. Images: width and height attributes. How to fix Cumulative Layout Shift has each case.
4. A spinner or a skeleton
Frame 0.8 s shows the header and a loading spinner, or grey placeholder blocks; the content appears at 3.2 s.
The HTML arrived nearly empty and JavaScript built the page after downloading data. FCP is early and misleading (the spinner counts as content), LCP and Speed Index are late, and the page is fragile on slow connections. Render the first screen on the server, or at least the content that decides LCP, and let JavaScript take over afterwards. Skeleton screens are kinder than spinners but do not move the metrics.
5. A cookie banner or overlay over the fold
The 1.5 s frame is a finished page; the 2.0 s frame is the same page behind a full-screen consent dialog, or with a chat bubble and a newsletter pop-up over the hero.
The metrics may look fine and the visitor still cannot use the page. If the overlay is inserted into the flow rather than on top, it also shifts the layout. Keep consent dialogs to a bar or a corner card that does not cover the content, position it fixed, and never insert it above existing content.
Matching frames to the waterfall
The two views share a timeline, and the report shows them one above the other. For any frame, the bars that end just before its timestamp are what made that frame possible, and the bars still running are what the next frame is waiting for:
- The first non-blank frame lands just after the last render-blocking bar ends.
- The frame where the hero appears lands just after the hero image's bar ends. If that bar started late, story 2 applies.
- A frame with a font swap follows the font file's bar.
- A frame with an inserted banner follows the bar of the script that inserted it, often a third-party host.
Read together, "the page felt slow" becomes "the stylesheet blocked until 1.6 s, then the slider script requested the hero at 1.9 s", which is a ticket a developer can act on.
Step by step
1. Run the test on the page visitors actually land on
Product pages, articles, campaign landing pages. The home page filmstrip is rarely the one that matters.
2. Write down the four timestamps
The first non-blank frame, the frame with the LCP element, the first frame that looks finished, and any frame where something moved. Compare them with the lab table: FCP, LCP, Speed Index and CLS should agree with what you see. If the LCP value is later than the frame where the hero appears, the LCP element is something else; check the element line.
3. Name the story
Match the frames against the five stories. Most pages tell one main story and one minor one (blank-then-everything with a font jump; text-early-images-late with a cookie banner).
4. Fix the main story first
Each story has one lever: server and blocking files, image discovery and size, reserved space, server rendering, overlay placement. Change one thing at a time so the next filmstrip shows whether it worked.
5. Re-run and compare frame by frame
The report keeps every run under its own link. Put the before and after side by side and check the same four timestamps.
Platform notes
WordPress
Story 1 is usually the absence of a page cache (no caching plugin, or one that excludes the page), plus a theme and builder loading their CSS in <head>. Story 2 is a slider or a lazy-load plugin catching the hero. Story 3 is a Google Font loaded by the theme without font-display, which the caching plugins fix under their font settings, or a cookie plugin inserting its bar in the flow. Story 4 is rare on WordPress unless the theme renders the front page with JavaScript.
Shopify
Stories 1 and 2 are apps and theme sections rather than the platform: Shopify caches and serves over a CDN, so a blank stretch is almost always app scripts in <head>, and late images are usually a theme section that lazy-loads its first slide. Story 5 is common: pop-up apps for newsletters and discounts.
Static sites and single-page apps
Story 4 is the default for a client-rendered app; the fix is server-side rendering or static generation for the landing routes. Static sites tell story 3 most often, from web fonts without sized fallbacks.
Verify
- The first non-blank frame is at or before 1.8 s on the mobile run, and the LCP element is visible at or before 2.5 s.
- No two consecutive frames after FCP show content in different positions; lab CLS reads under 0.1.
- The frame at the LCP timestamp looks like the finished page to you, not like a page with holes.
Common mistakes
- Reading the desktop filmstrip. Symptom: everything looks fine and the site still fails on mobile. Fix: the mobile run is the throttled one and the one Google ranks on.
- Treating a spinner as "content". Symptom: FCP at 0.6 s, LCP at 4 s, and the FCP finding passes. Fix: the spinner is a symptom of story 4; the metric to watch is LCP.
- Fixing the image when the font caused the jump. Symptom: CLS unchanged after sizing every image. Fix: look at the frame where the shift happens and at the CLS finding's element list before choosing the fix.
- Comparing runs from different times of day. Symptom: the "after" run looks better, but the server was simply quieter. Fix: run each test twice and compare the pair, or use WebPageTest's repeated runs.