# How to read a website speed test

> A speed test returns a score, five metrics and a list of opportunities. This guide explains what each number means for a visitor, which ones Google uses for ranking, why the same page scores differently on every run, and how to turn the list into three fixes that matter.

Updated 2026-09-25 · Speed & Core Web Vitals · HTML version: https://getreport.app/guides/reading-a-website-speed-test

A speed test gives you more numbers than you need and one number you cannot trust on its own. The score moves between runs, the metrics have names nobody explains, and the "opportunities" list is sorted by an estimate that is often wrong for your site. This guide walks through the result of a getReport speed test in the order that matters: what the visitor felt, what Google measures, and what to do first.

## Quick answer

- The **field data** (real visitors, from Chrome's CrUX dataset) decides Google's Core Web Vitals assessment. The **lab score** (Lighthouse) is a reproducible diagnosis, not the ranking signal.
- Three metrics matter for ranking: **LCP** (loading, ≤ 2.5 s), **INP** (responsiveness, ≤ 200 ms), **CLS** (stability, ≤ 0.1).
- A lab score that moves 5–10 points between runs is normal; look at the metrics, not the score.
- Fix in this order: the LCP element (usually the hero image or a web font), render-blocking CSS/JS, layout shifts from images and fonts, then JavaScript weight.
- Run the [speed test](https://getreport.app/tools/speed-test) on mobile first; it is the score Google uses.

## Why the numbers disagree

There are two kinds of data. **Lab data** comes from one run on one simulated device (a mid-range phone on a slow 4G connection, throttled to a fixed CPU speed) at the moment you tested. **Field data** is what real Chrome users experienced on your pages over the last 28 days, aggregated by Google. They disagree for good reasons: your visitors have different phones and connections, they hit cached pages, they scroll before the ads load. Google's ranking signal uses field data when there is enough of it; the lab data tells you *why* the field numbers look the way they do.

The lab score also moves between runs. Lighthouse simulates a slow connection, but the server's response time, a CDN cache miss, a third-party script that took longer this time, and the test machine's own load all change the result. A 6-point swing is normal; a 20-point swing usually means the server or a third party is inconsistent, which is itself a finding.

## How getReport checks it

> **Free tool:** [Website speed test](https://getreport.app/tools/speed-test): Lighthouse lab results and real-user Core Web Vitals for any page, mobile and desktop, with a filmstrip, a request waterfall and a fix for every slow part. Free, no signup.
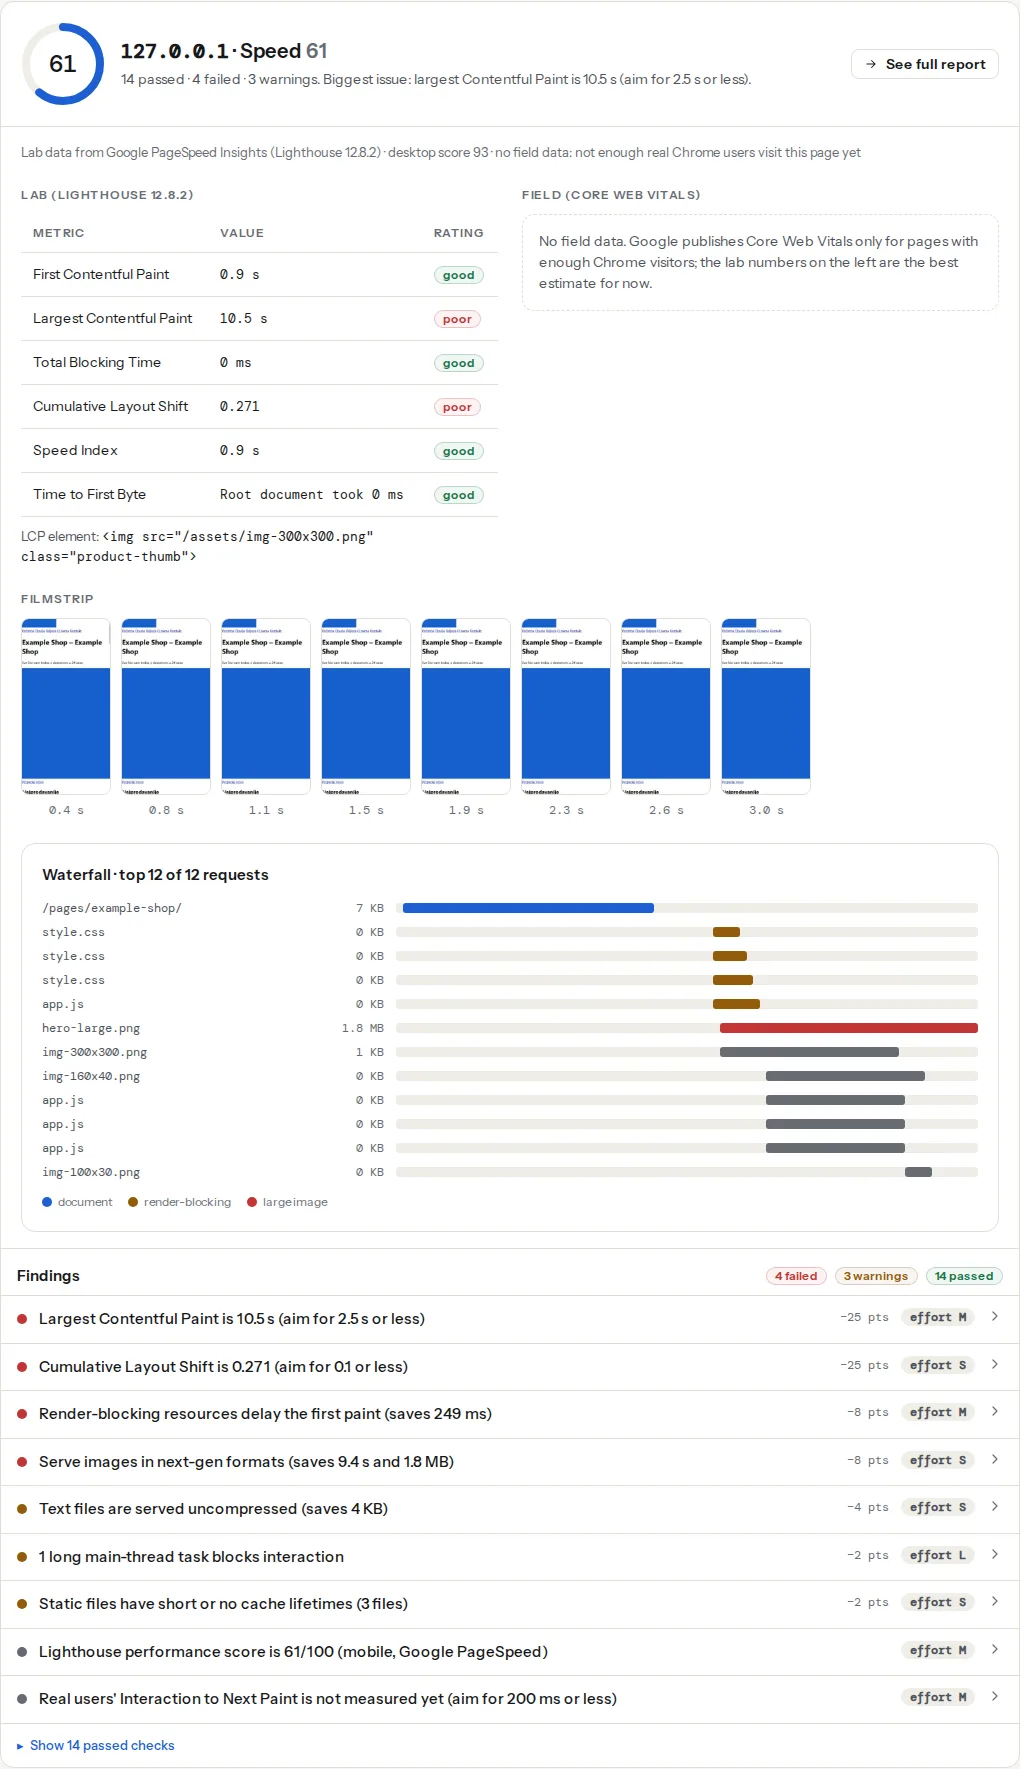
![The speed test result for a slow shop page: the Lighthouse performance score, the metric rows with their thresholds, and the opportunities ordered by how much time they save](https://getreport.app/guides/img/reading-a-website-speed-test/result.webp "Look at the metrics first and the opportunities second; the score is a summary of the metrics, not a to-do list.")

The speed module asks Google's PageSpeed Insights for a Lighthouse run of the page (mobile by default) and the CrUX field data for the URL and the origin; when Google's API is unavailable, a local Lighthouse run in our own Chromium stands in. The findings map each Lighthouse audit to plain language with a fix, and the module panel shows the Core Web Vitals bars, the filmstrip and the waterfall.

> **Check: Lighthouse performance score.** This is the number Google's own tools show for your page. It combines five of the lab metrics below (all except TTFB), weighted the way Lighthouse weights them. 90 and above is green.
>
> 1. Work through the failed metrics and opportunities below in order of points; the score follows.

> **Check: Largest Contentful Paint.** LCP is when the biggest thing on screen — usually the hero image or headline — finishes loading. Visitors judge "is this site slow?" on it, and Google uses it for ranking.
>
> 1. Find the LCP element (named in your report) and make it lighter, earlier or both — a compressed WebP/AVIF, sized to the screen, without lazy loading.
> 2. Preload it with <link rel="preload" as="image"> or add fetchpriority="high" on the <img>.
> 3. Cut what comes before it — render-blocking CSS/JS and slow server responses push LCP back.

> **Check: Interaction to Next Paint.** INP measures how quickly the page reacts when someone taps or clicks. Lab tools cannot simulate it, so this comes from real Chrome users; slow responses feel like a frozen page.
>
> 1. Break up long JavaScript tasks and defer third-party scripts so the main thread is free when people interact.
> 2. Respond to input visually first (a pressed state, a spinner), then do the heavy work.
> 3. Reduce DOM size and avoid layout-heavy work inside click handlers.

> **Check: Cumulative Layout Shift.** CLS measures how much the page jumps around while loading — the button that moves just as someone taps it. It is one of Google's three Core Web Vitals.
>
> 1. Give every <img>, <video>, ad slot and embed explicit width and height (or aspect-ratio) so space is reserved before it loads.
> 2. Preload the main web font and use font-display optional, or swap with a size-adjusted fallback font, so text does not reflow.
> 3. Never insert banners or content above existing content after load.

## The metrics, in visitor terms

| Metric | What the visitor feels | Good | Used for ranking |
| --- | --- | --- | --- |
| TTFB (Time to First Byte) | How long the page "thinks" before anything arrives | ≤ 0.8 s | Indirectly (it delays everything) |
| FCP (First Contentful Paint) | The first text or image appears | ≤ 1.8 s | No |
| LCP (Largest Contentful Paint) | The main thing on screen (hero, headline, product photo) is visible | ≤ 2.5 s | **Yes** |
| Speed Index | How quickly the visible area fills in | ≤ 3.4 s | No |
| TBT (Total Blocking Time) | How long the page ignores taps while scripts run (lab stand-in for INP) | ≤ 200 ms | No (INP is) |
| INP (Interaction to Next Paint) | The delay between a tap and the screen reacting, over the whole visit | ≤ 200 ms | **Yes** (field only) |
| CLS (Cumulative Layout Shift) | Things jumping while the page loads | ≤ 0.1 | **Yes** |

Two things to note. INP only exists in field data; the lab test cannot click around like a visitor, so it reports TBT as a proxy. And "good" thresholds are measured at the 75th percentile of visits: three quarters of visits must be under the threshold for the page to pass.

## Step by step

### 1. Look at the field bars first

If the page has enough traffic, the panel shows the CrUX bars for LCP, INP and CLS with the share of visits in good, needs-improvement and poor. Those are the numbers Google uses. A page can score 95 in the lab and fail the field assessment because real visitors on old phones see a 3.2 s LCP; the reverse also happens.

No field bars means the page does not have enough Chrome visitors in the last 28 days; Google then uses the origin's data if it has any, and otherwise nothing. Small sites are judged by the origin as a whole.

### 2. Find the LCP element

The LCP finding names the element: an image, a heading, a video poster. Everything before it on the timeline is what delays it. The filmstrip shows the moment it appeared. Typical causes in order of frequency: the image is large (see [Image sizes that do not hurt](https://getreport.app/guides/image-sizes-that-do-not-hurt)), the image is lazy-loaded, a web font blocks the headline, render-blocking CSS delays everything, or the server itself is slow (TTFB). [How to fix Largest Contentful Paint](https://getreport.app/guides/fix-largest-contentful-paint) walks through each.

### 3. Read the opportunities as a list of causes, not a to-do list

Lighthouse estimates the seconds each opportunity would save, and the estimates are rough. "Eliminate render-blocking resources: 1.2 s" often overlaps with "Reduce unused CSS: 0.8 s"; fixing one changes the other. Use the list to understand what the page is doing, then pick the fix that addresses the LCP element directly.

### 4. Check TBT and the long tasks

A high TBT with a low LCP means the page appears quickly and then freezes: a tag manager loading twelve tags, a slider initialising, an analytics script parsing. The main-thread work finding lists the scripts by time. This is what visitors feel as "the menu did not open when I tapped it", and it is what INP measures in the field.

### 5. Look for layout shifts

The CLS finding lists the elements that moved. Images without dimensions, web fonts swapping, cookie banners inserted at the top, and ads are the usual four. Each has a mechanical fix; see [How to fix Cumulative Layout Shift](https://getreport.app/guides/fix-cumulative-layout-shift).

### 6. Compare mobile and desktop

Desktop scores are always higher: faster CPU, faster network, larger viewport where the hero is smaller relative to the screen. Google ranks on mobile. If desktop is 95 and mobile is 60, the difference is almost always image bytes and JavaScript execution, both of which hurt more on a phone.

## Reading the waterfall and the filmstrip

The waterfall lists every file in the order it was requested, with a bar for the time spent waiting and downloading. Look for: a long first bar (slow server), a chain of files each waiting for the previous one (CSS importing CSS, scripts loading scripts), and a large file that starts late (a lazy-loaded hero). The filmstrip shows what the visitor saw at each moment; the frame where the page first looks "done" is the one to compare against LCP.

## What a good result looks like

Mobile: LCP under 2.5 s with the hero as the LCP element, CLS under 0.05, TBT under 200 ms, score 90+. Field bars mostly green. Desktop follows. Small sites on decent hosting with optimised images get there without a CDN; sites with page builders and many plugins usually need to remove things rather than add them.

## Verify

- Run the test three times; the metrics should agree within a few hundred milliseconds. Large swings point at the server or a third party.
- After a fix, wait for the CDN cache to warm, then re-test. The report link keeps the before/after.
- Field data updates daily but covers 28 days; expect a month before Search Console's Core Web Vitals report reflects a fix.

## Common mistakes

- **Optimising for the score.** A score is a weighted sum of the metrics; a 90 with a 2.4 s LCP is fine, a 92 from inlining everything and breaking caching is not.
- **Testing the home page only.** Product and article pages carry the traffic and have different LCP elements.
- **Testing from the office.** Fast Wi-Fi and a laptop are not the visitor's phone; the test's throttling is closer to reality than your browser.
- **Adding a plugin to fix a plugin.** Each optimisation plugin adds scripts of its own; measure before and after.
- **Ignoring field data because the lab score is green.** Google does the opposite.
