# Field data vs lab data: why PageSpeed and Search Console disagree
> Lab data is one throttled test run; field data is 28 days of real Chrome visitors. Why the two disagree, which one Google ranks with, and what to do in each of the four combinations.
Updated 2026-09-25 · Speed & Core Web Vitals · HTML version: https://getreport.app/guides/field-data-vs-lab-data
PageSpeed Insights says your LCP is 1.9 s and green. Search Console says the same URLs are "poor" and need fixing. Both are right, because they are measuring different things: one is a single test run on a simulated phone in a Google data centre, the other is what your actual visitors experienced over the last four weeks. Once you know which is which, the disagreement stops being confusing and starts telling you something useful about your visitors. This guide explains both kinds of data, the four ways they can combine, and what to do in each case.
## Quick answer
| | Lab data | Field data |
| --- | --- | --- |
| Source | Lighthouse, one run, now | Chrome UX Report (CrUX), real Chrome users, last 28 days |
| Device | A simulated mid-range phone, 4× slower CPU, slow 4G | Whatever your visitors own, on their networks |
| Cache | Cold: nothing cached, first visit | Mixed: many visitors have your CSS and fonts already |
| Statistic | One measurement | 75th percentile of all visits |
| Has INP | No (Total Blocking Time stands in) | Yes |
| Used for ranking | No | Yes |
| Exists for | Any URL | Only pages and sites with enough Chrome traffic |
- Field data decides Google's page experience signal and everything in Search Console's Core Web Vitals report.
- Lab data is the diagnosis: it tells you *why* the field numbers look the way they do, on a device you can reproduce.
- Green lab, red field: your visitors are on slower devices or slower pages than the one you tested. Red lab, green field: your visitors have better devices than the lab, or caches are doing the work.
- Run the [Core Web Vitals checker](https://getreport.app/tools/core-web-vitals) to see both side by side for one page.
## Why the difference matters
If you optimise for the wrong number you can spend a month making the lab score green while Search Console keeps reporting failures, because the changes did not reach the visitors that were slow. The opposite waste is common too: a site with a lab score of 45 whose real visitors are perfectly happy, where the owner rebuilds the theme to chase a number Google does not rank with.
The two datasets differ for concrete reasons, each of which is a clue about your audience:
- **Device mix.** The lab throttles the CPU 4× to imitate a mid-range Android phone. If your visitors are mostly on recent iPhones, the field is faster than the lab; if they are on €120 Android phones, it can be slower.
- **Network and geography.** The lab simulates a 1.6 Mbps connection with 150 ms round trips from a US or European data centre. A visitor in the same city as your server on Wi-Fi beats that; a visitor on 3G on another continent does not.
- **Caching.** The lab starts with an empty cache. Returning visitors already have your CSS, fonts and logo, so their LCP is the HTML plus the hero image, nothing else. A site with mostly returning visitors looks better in the field than in the lab.
- **Which pages.** The lab tests the one URL you entered. The field data for an *origin* covers every page, weighted by traffic: if the blog gets 80 % of visits and is slow, the origin is slow no matter how fast the home page is.
- **Logged-in users and personalisation.** The lab is anonymous and gets the cached page. Logged-in customers bypass the page cache and get the slow uncached version; they are in the field data.
- **Cookie banners and interactions.** Field visitors tap the consent banner, open the menu, scroll before the ads have loaded. INP only exists because of them; CLS in the field includes shifts that happen after the lab stopped recording.
- **Time.** The lab is now. The field is a 28-day window, so a fix made today reaches full effect in the field about four weeks later, and a regression from three weeks ago is still in the number.
None of these is an error. They are the difference between a controlled experiment and a population; Google's own [lab and field data](https://web.dev/articles/lab-and-field-data-differences) article lists the same causes.
## How getReport checks it
> **Free tool:** [Core Web Vitals checker](https://getreport.app/tools/core-web-vitals): LCP, INP and CLS for your page from real Chrome users, plus the lab values and the exact element or script responsible. Pass or fail against Google’s thresholds.
The report shows both datasets in one panel. On the left, the lab table from a Lighthouse run through Google's PageSpeed Insights (mobile by default, with a rating chip per metric and the LCP element named). On the right, the field bars from the Chrome UX Report: the 75th percentile of LCP, INP and CLS over 28 days, each with the share of visits that were good, needs improvement and poor. When the page has enough traffic the bars are for the URL; otherwise they fall back to the origin and the panel says "whole site". When neither exists, the panel says so instead of showing a number:
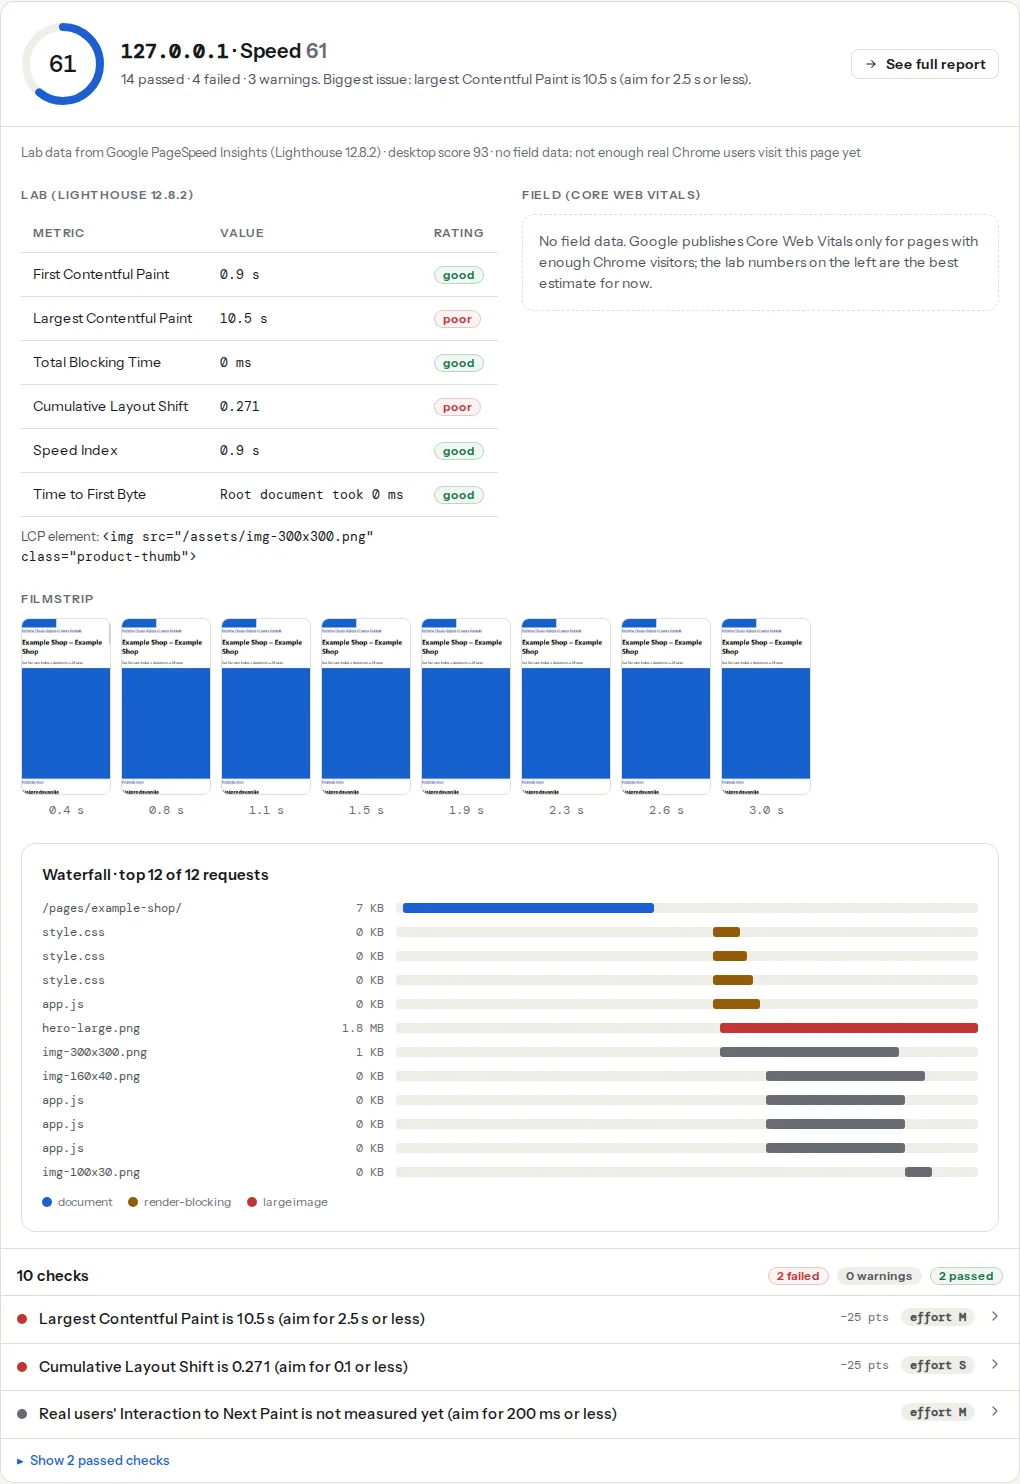
Four findings correspond to the two datasets. The lab LCP is scored:
> **Check: Largest Contentful Paint.** LCP is when the biggest thing on screen — usually the hero image or headline — finishes loading. Visitors judge "is this site slow?" on it, and Google uses it for ranking.
>
> 1. Find the LCP element (named in your report) and make it lighter, earlier or both — a compressed WebP/AVIF, sized to the screen, without lazy loading.
> 2. Preload it with or add fetchpriority="high" on the .
> 3. Cut what comes before it — render-blocking CSS/JS and slow server responses push LCP back.
The field LCP is an information row, because it is Google's number rather than something the report measured:
> **Check: Real-user Largest Contentful Paint.** LCP is when the biggest element on screen finishes loading. Google's threshold for "good" is 2.5 s at the 75th percentile of real Chrome users.
>
> 1. Find the LCP element in the Speed module and make it smaller, earlier or both.
INP is field-only. The report's `inp` finding is rated against Google's threshold when field data exists and reads "not measured yet" when it does not; there is no lab substitute in that row, only Total Blocking Time elsewhere in the table:
> **Check: Interaction to Next Paint.** INP measures how quickly the page reacts when someone taps or clicks. Lab tools cannot simulate it, so this comes from real Chrome users; slow responses feel like a frozen page.
>
> 1. Break up long JavaScript tasks and defer third-party scripts so the main thread is free when people interact.
> 2. Respond to input visually first (a pressed state, a spinner), then do the heavy work.
> 3. Reduce DOM size and avoid layout-heavy work inside click handlers.
> **Check: Real-user Interaction to Next Paint.** INP is how long the page takes to visibly react to taps and clicks, measured on real Chrome users over the last 28 days. Google's threshold for "good" is 200 ms.
>
> 1. Cut long JavaScript tasks and heavy third-party scripts; see the INP finding above.
The report header also states which device the lab run used (mobile or desktop) and the speed panel notes whether the field data is for this page or the whole site. Read both lines before comparing numbers; a desktop lab run next to phone field data explains most "disagreements" on its own.
## Step by step
### 1. Establish which dataset each tool is showing you
- **Search Console → Core Web Vitals**: field only. It groups URLs with similar paths into groups, takes the CrUX data of the URLs in each group that have it, and labels the whole group good, needs improvement or poor. A group can be "poor" because of two heavily visited URLs while the one you tested is fine.
- **PageSpeed Insights**: both, in two sections. "Discover what your real users are experiencing" at the top is field; "Diagnose performance issues" below is lab. The pass/fail verdict at the very top is the field.
- **Lighthouse in Chrome DevTools**: lab only, on your own machine, which is faster than the lab's throttled phone unless you set throttling.
- **getReport**: both in the speed panel, with the lab metrics scored and the field rows marked as information.
### 2. Put your page in one of four boxes
Compare the lab LCP with the field LCP for the same device (phone lab against phone field, which is the report's default):
**Green lab, green field.** Done for this metric. Keep the 40-week history open so you notice if it changes: [Core Web Vitals history](https://getreport.app/guides/core-web-vitals-history-40-weeks).
**Green lab, red field.** The tested page is fast on a simulated phone, but real visits are not. The usual reasons, in order: the field is for the origin and other pages are slow (test the top three URLs from your analytics, not just the home page); a large share of visitors on slow devices or networks; logged-in visitors who bypass the cache; a slow third party (chat, ads, A/B testing) that the lab happened to load quickly or that only loads after consent. Look at the distribution bar under the field metric: 60 % good and 30 % poor is a device or geography split; 70 % good and 25 % needs improvement is a page that is a little heavy for everyone.
**Red lab, green field.** Your visitors do better than the throttled lab: they have modern phones, they are close to the server, they are mostly returning with warm caches, or the site is a B2B tool used on desktops. This is the box where the score is not the problem. Fix the lab findings when they are cheap (they still help the slowest quarter of visitors) but do not rebuild the site over it.
**Red lab, red field.** The lab is telling you why the field is red. Work through the lab findings in order of the seconds they save; start with the LCP element, then render-blocking files, then JavaScript. [Core Web Vitals for site owners](https://getreport.app/guides/core-web-vitals-for-site-owners) has the order.
### 3. Treat INP as a field-only metric
There is no lab [INP](https://getreport.app/learn/interaction-to-next-paint) because a lab run does not tap, type or scroll like a visitor. [Total Blocking Time](https://getreport.app/learn/total-blocking-time) is the stand-in: it adds up the time the main thread was blocked by JavaScript during load, which is usually what makes real interactions slow. A high TBT with no field INP means "probably a problem, unverifiable here". A good TBT with a poor field INP means the slowness happens later: a heavy click handler, a menu that re-renders the page, a search box that filters 2,000 products on every keystroke. Only field data or your own measurement (step 5) can see that.
### 4. Check the same device and the same scope
Before deciding anything, make sure you are comparing like with like. The lab run defaults to mobile; the field bars in the report are phone data. Search Console reports mobile and desktop separately, and the mobile report is the one that reflects most sites' traffic and Google's mobile-first indexing. And check the scope line: "this page" against "whole site" is a different population.
### 5. Add your own field measurement
CrUX gives you one number per metric per 28 days, for Chrome users only, and nothing at all for a small site. Real user monitoring (RUM) closes those gaps: a small script measures the same metrics on every visit and sends them to your analytics, so you get per-page and per-device numbers the next day. Google's `web-vitals` library is the reference implementation and uses the same definitions as CrUX:
```html
```
The `/vitals` endpoint can be anything that stores a row per beacon; a 20-line handler that appends to a table is enough. If you use Google Analytics 4, the same callbacks can call `gtag('event', metric.name, { value: metric.delta, metric_id: metric.id })` and the events show up in GA4's explorations. Calculate the 75th percentile per page and per device type yourself; averages hide the slow quarter that Google looks at. Self-hosting the script instead of loading it from a CDN keeps it out of your Content-Security-Policy and off the third-party list.
> **Note:**
> RUM adds one small script and one request per page view. On a site with strict privacy rules, send no identifiers: the metric, the path, the device type and a random per-view id are all you need.
### 6. Wait the right amount of time
A fix changes the lab number the moment the cache is warm. The field number is a rolling 28-day window, so it moves a little every day and reaches full effect after four weeks. Search Console updates from the same data and adds its own delay; expect a "validation" you start there to take 28 days to conclude. The history tool shows the slope week by week, which is the earliest reliable signal that a fix has landed: [Core Web Vitals history](https://getreport.app/tools/cwv-history).
## Platform notes
**WordPress**: the most common green-lab-red-field cause is logged-in users (members, WooCommerce customers) who get uncached pages, plus a heavy admin bar. Test the site logged in on a phone once to see what they see. **Shopify**: field data is usually for the origin; the slow pages are collections with many product images, so test one of those rather than the home page. **Single-page apps**: the lab measures the initial load; the field includes soft navigations only partially (CrUX attributes them to the entry URL), so INP from client-side routing is where the two disagree most.
## Verify
- The report's speed panel shows field bars for the page (or the origin) and the lab table on the same device; you know which box the page is in.
- After a fix: the lab metric improves immediately on a re-run; the field p75 moves over the next four weeks in the history tool; Search Console's group changes status after its validation period.
- If you added RUM: the p75 for the page on phones agrees with CrUX within a few hundred milliseconds once you have a few thousand views. Large disagreement means the script is measuring a different population (for example, only logged-in users).
## Common mistakes
- **Optimising the desktop lab score.** Symptom: PageSpeed desktop 98, Search Console mobile "poor". Google indexes and judges the mobile experience; test on mobile first.
- **Testing only the home page.** Symptom: green lab on the home page, red field for the origin. Test the pages that carry the traffic, from your analytics.
- **Expecting the field to move the day after a fix.** Symptom: "the fix did not work" after a week. It is a 28-day window; check the history slope instead.
- **Treating "no field data" as a failure.** Symptom: worry about a site with no CrUX bars. It means too few Chrome visitors to publish a number, nothing more; Google then has no field signal for the site and the lab is your best proxy.
- **Reading TBT as INP.** Symptom: TBT 80 ms and field INP 350 ms. TBT only covers the load; the slow interaction happens later. Measure it with RUM or reproduce it in DevTools with CPU throttling on.