# Explaining a getReport score to a client (or your boss)
> What the scores, grades, points and effort labels mean, what they do not measure, and a three-sentence template that turns a number into a decision: the biggest issue, its cost, and the fix.
Updated 2026-09-25 · Workflows & checklists · HTML version: https://getreport.app/guides/explaining-a-score-to-a-client
"We got a 68. Is that bad?" is the question every score invites, and the honest answer ("it depends what it is made of") does not land in a meeting. What does land is a translation: the number, the one thing behind it, what that one thing costs visitors, and what it takes to fix. This guide explains what the numbers in a getReport report are and are not, gives you a three-sentence template, and shows how to turn each common finding into an outcome a client or a manager cares about. Reading it takes ten minutes; the conversation afterwards takes three.
## Quick answer
- **Module scores** (0–100) start at 100 and lose each failed check's weight, half for a warning. **Speed** is the exception: it is the Lighthouse performance score, as Google's tools show it.
- **Overall** is a weighted average: Speed 30 %, SEO 25 %, Security 15 %, Accessibility 10 %, Best practices 10 %, Structured data 5 %, Social 5 %. Grade A from 90, B from 80, C from 70, D from 50, F below.
- **Points** on a finding are the module points it would give back; **effort** is S, M or L.
- The score is a health index. It is not a ranking prediction, not a comparison with anyone else, and not a target to hit 100.
- The template: "Your site scores X. The biggest issue is Y, which costs visitors Z. Fixing it takes about N hours."
- Show progress with the history strip on the report and the real-user chart from the [Core Web Vitals history tool](https://getreport.app/tools/cwv-history), not with a single run.
## Why the explanation matters more than the number
A score without an explanation produces one of two wrong reactions. Either "68 is fine, leave it", when the 68 hides a hero image that loses a third of mobile visitors; or "68 is a disaster, rebuild it", when the 68 is thirty small warnings and one afternoon of work would make it an 85. The number is the same; the decisions are opposite; and the difference is entirely in what the number is made of.
The second reason is trust. A client who has been told "we will get you to 100" will hold you to it, and some items on a hosted platform cannot be fixed at all. A client who has been told what the score measures, what it does not, and which three things matter will fund those three things. That is a better month for everyone.
## How getReport checks it
> **Free tool:** [Website speed test](https://getreport.app/tools/speed-test): Lighthouse lab results and real-user Core Web Vitals for any page, mobile and desktop, with a filmstrip, a request waterfall and a fix for every slow part. Free, no signup.
The [speed test](https://getreport.app/tools/speed-test) runs the full report and opens the Speed module; the SEO audit opens the same report at SEO. The section to put in front of a client is Top fixes, just under the score row:
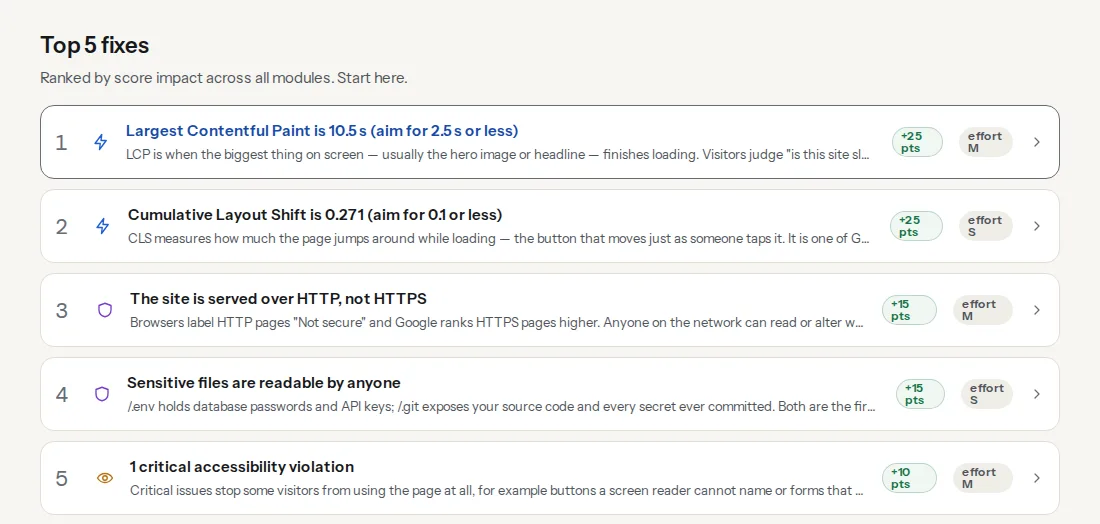
Three findings show the three kinds of number a client will ask about:
> **Check: Lighthouse performance score.** This is the number Google's own tools show for your page. It combines five of the lab metrics below (all except TTFB), weighted the way Lighthouse weights them. 90 and above is green.
>
> 1. Work through the failed metrics and opportunities below in order of points; the score follows.
This is the Speed score itself, so it carries no points of its own. It is the same number PageSpeed Insights shows, which matters when a client runs that tool too: you are not disagreeing with Google, you are explaining Google.
> **Check: Largest Contentful Paint.** LCP is when the biggest thing on screen — usually the hero image or headline — finishes loading. Visitors judge "is this site slow?" on it, and Google uses it for ranking.
>
> 1. Find the LCP element (named in your report) and make it lighter, earlier or both — a compressed WebP/AVIF, sized to the screen, without lazy loading.
> 2. Preload it with or add fetchpriority="high" on the .
> 3. Cut what comes before it — render-blocking CSS/JS and slow server responses push LCP back.
This is a lab measurement: one run on a simulated phone. It carries 25 points because Lighthouse weights it that way, which is why a slow hero image so often sits at the top of Top fixes.
> **Check: Real-user Largest Contentful Paint.** LCP is when the biggest element on screen finishes loading. Google's threshold for "good" is 2.5 s at the 75th percentile of real Chrome users.
>
> 1. Find the LCP element in the Speed module and make it smaller, earlier or both.
This is the same metric measured on real Chrome visitors over 28 days, at the 75th percentile. It carries no points, because it is a fact about visitors rather than something the page can be marked down for, and it is the number Google ranks with. When it exists, it is the number to quote to a client; the lab number is the reason behind it.
## Step by step
### 1. Say what the number is, in one sentence each
**A module score** is a list of checks with weights. Each failed check subtracts its weight, each warning half of it, and passed and info items subtract nothing. A missing page title (weight 10) on its own takes SEO from 100 to 90. So a module score is "how many of the things we check are wrong, and how badly".
**The Speed score** is different: it is Lighthouse's performance score, taken as is, built from five lab metrics with Google's weights. 90 and above is green.
**The overall score** is the weighted average of the modules that ran, with Speed counting most. That is why ten Speed points move the grade three times as much as ten Social points, and why "we fixed all the social preview items" can leave the grade where it was.
**Points** on a finding are what the module would gain if that finding passed. **Effort** is a rough size: S is a setting or a line, M is an afternoon, L is a project. Read them together: a "+10 pts, effort S" item is the best first job in any list.
The full anatomy, module by module, is in [how to read a getReport report](https://getreport.app/guides/reading-a-getreport-report).
### 2. Say what it is not, before anyone asks
- **Not a ranking prediction.** Google does not use this score. The checks cover things that affect rankings and visitors, but 95 does not mean page one and 70 does not mean page ten.
- **Not a comparison.** The score is absolute: a 68 is a 68 whether every competitor scores 40 or 95. If the client wants a comparison, run the competitors' equivalent pages on the same device and compare findings, not grades.
- **Not a target of 100.** Some findings are platform limits (a hosted builder that cannot set headers), some are trade-offs the site chose on purpose, and Lighthouse moves a few points between runs regardless. Aim for "the batch passed", not for a number.
- **Not the whole site.** It is one page on one device. The home page is not the checkout.
### 3. Use the three-sentence template
```text
Your site scores 68 on mobile (grade D); Speed is the module pulling it down, at 51.
The biggest issue is the hero image on the home page: it is 2.4 MB, so the
main content appears after 4.1 s on a phone, and roughly a third of mobile
visitors leave before that.
Fixing it is about two hours: compress the image, set it to load first,
and re-run the report. That one change is worth about 25 Speed points.
```
Sentence one: the number and the module behind it. Sentence two: the top finding, with its measurement and what it costs visitors. Sentence three: the effort and what passes. The numbers come from the score row, the Top fixes list and the finding's technical detail. Write it once per month and it becomes the monthly note; the routine around it is in [agency workflow: one report per client, every month](https://getreport.app/guides/agency-workflow-one-report-per-client-every-month).
### 4. Translate each finding into an outcome
A finding is a fact about the page. A client wants a consequence. The common translations:
| Finding | Say this |
| --- | --- |
| LCP over 2.5 s | "The main content appears late; on phones, visitors leave before it does. Google also uses this for ranking." |
| Total Blocking Time high | "The page freezes for a moment after it appears; taps do nothing. Usually a chat widget or tag manager." |
| Broken links | "Visitors and Google hit dead ends; on a shop that is a lost sale per click." |
| Strict-Transport-Security missing | "A visitor's first request can be intercepted on public Wi-Fi. One line to fix." |
| Images without alt text | "Screen readers cannot describe them, accessibility rules in most markets require it, and Google Images cannot index them." |
| No canonical tag | "Google may index copies of the same page and split its ranking between them." |
| Certificate expiring | "In N days every browser shows a full-page warning and most visitors leave." |
| Missing Open Graph image | "Shared links show no picture on LinkedIn and Facebook, so fewer people click." |
Each finding's "Why it matters" line is written for this purpose; the table just makes it shorter.
### 5. Field vs lab, in one sentence
"The lab number is one test on a simulated phone and tells us why; the real-user number is what your visitors actually experienced over the last month and is what Google uses." When both exist and disagree, quote the real-user one and use the lab one to explain it. When there is no real-user number, the site has too few Chrome visitors to be in Google's dataset, which is normal for small sites, not a fault. The longer version is [field data vs lab data](https://getreport.app/guides/field-data-vs-lab-data).
### 6. Why mobile is lower, in one sentence
"The mobile test simulates a mid-range phone on a slow connection, and most of your visitors are on phones, so that is the number we manage to." A desktop score 20 points higher is expected, not a contradiction. Always compare mobile with mobile.
### 7. Set a realistic monthly goal
A goal in findings, not points: "the top three items in Top fixes pass by the end of the month". In score terms, that is typically 10–20 module points for a site that has not been looked at, and 3–8 once the big items are done. After the first two months the curve flattens, and the honest message is "the remaining items are small or platform-limited; we move to keeping it there". A goal of "+5 every month forever" is a promise the maths cannot keep.
### 8. Say when the score will not move
Some things are outside the site's control, and it is better to name them in the first meeting than to be asked about them in the sixth:
- **Hosted platforms** (Shopify, Wix, Squarespace, Webflow on standard plans) set their own server headers and caching. The findings stay open; they are not a fault of the work.
- **Third-party scripts the business insists on** (a chat widget, an A/B tool, three ad networks). The report shows their weight; the decision is the client's, and the score reflects it.
- **Lighthouse variance**: a few points between runs, from network and server noise. Changes under 5 points are not news.
### 9. Show progress with history, not with one run
Two things make a before/after credible:
- The **history strip** under the score row, which appears once the domain has earlier reports: a small trend line per score and the change since the previous report for Overall, Speed, SEO and Security. Two report links, the old and the new, are the evidence.
- The **Core Web Vitals history chart**: up to 40 weekly points of what real Chrome visitors experienced. A line crossing from amber into green three or four weeks after a fix is the strongest proof available, because it is Google's own data.
### 10. Bring the PDF to the meeting
The **PDF** button in the report header exports the whole report with every finding expanded. It does not change after the fact, it prints, and it lets the client read the "why" of each item at their own pace. For the developer, the fixes view is the better hand-over; for the meeting, the PDF.
## Platform notes
### Agencies
Keep the score conversation to the first month, in writing, and then report in findings. The monthly note format (three numbers, two fixes shipped, one next step) is in the agency workflow guide.
### In-house, reporting to a manager
Managers ask "compared to what?". Offer two comparisons that are fair: last month's report of the same page (the history strip), and one competitor's equivalent page on the same device, findings side by side. Decline the third one, "compared to 100".
## Verify
- The client or manager can say back, in their own words, which one finding matters most and what it costs.
- The goal for the month is written as findings to pass, with a report link as the baseline.
- Next month's report shows those findings passed and the history strip shows the delta.
- No promise of a specific score exists in writing.
## Common mistakes
- **Leading with the grade.** "D" ends the conversation. Lead with the top finding and its cost, then the grade.
- **Promising 100.** Platform limits and variance make it impossible on most sites, and it turns every month into an argument.
- **Comparing with a competitor's desktop score.** Same device, same page type, or not at all.
- **Quoting the lab LCP when real-user data exists.** The client's own Search Console shows the real-user number; quote the same one.
- **Reporting a 3-point rise as a win.** It is noise. Report the finding that passed.